Figure 7.
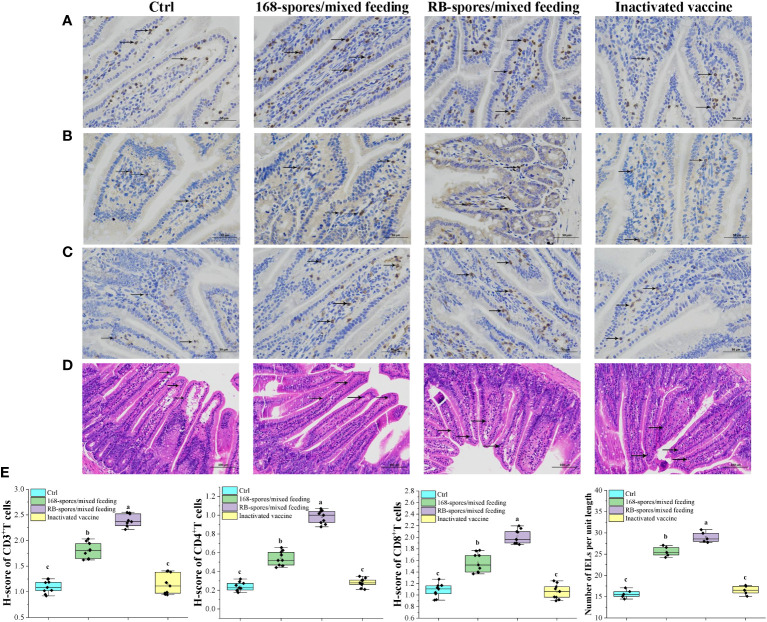
The distribution of CD3+, CD4+, CD8+ T lymphocytes and IELs in intestinal mucosa was observed and quantitatively analyzed. (A–C) Distribution of CD3+, CD4+ and CD8+ T lymphocytes in the ileal mucosa, black arrows indicate typical positive cells. Magnification of 400×. (n=9) (D) Distribution of IELs cells in the small intestinal mucosa. IELs are shown by black arrows, which are distributed in the mucosal epithelial layer of the small intestine, with irregular nuclei and darker staining than epithelium. Magnification of 200×. (n=5) (E) The number of CD3+, CD4+ and CD8+ T lymphocytes in the intestinal mucosa, expressed as H-score. And the number of IELs per unit length in the intestinal villi. H-score is a value between 0-300, the larger the value, the stronger the comprehensive positive intensity and the more positive cells. Data are presented as means ± standard deviation. One-way ANOVA followed by a Friedman test was performed, bars with different letters indicate a significant difference (P < 0.05).

