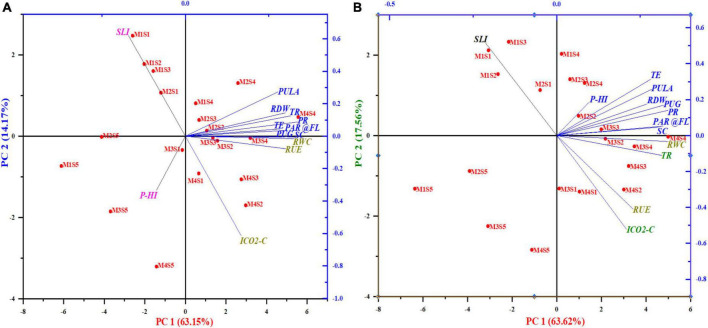
FIGURE 10.
Two-dimensional graphical biplot depicting the loadings and score plot formed by principal components 1 and 2 of photosynthetic indices, RUE, RWC, RDW, and grain-P uptake of maize (A) and wheat (B). Percentage values on PC1 and PC2 indicate the respective variance explained by the first two PCA axes.

