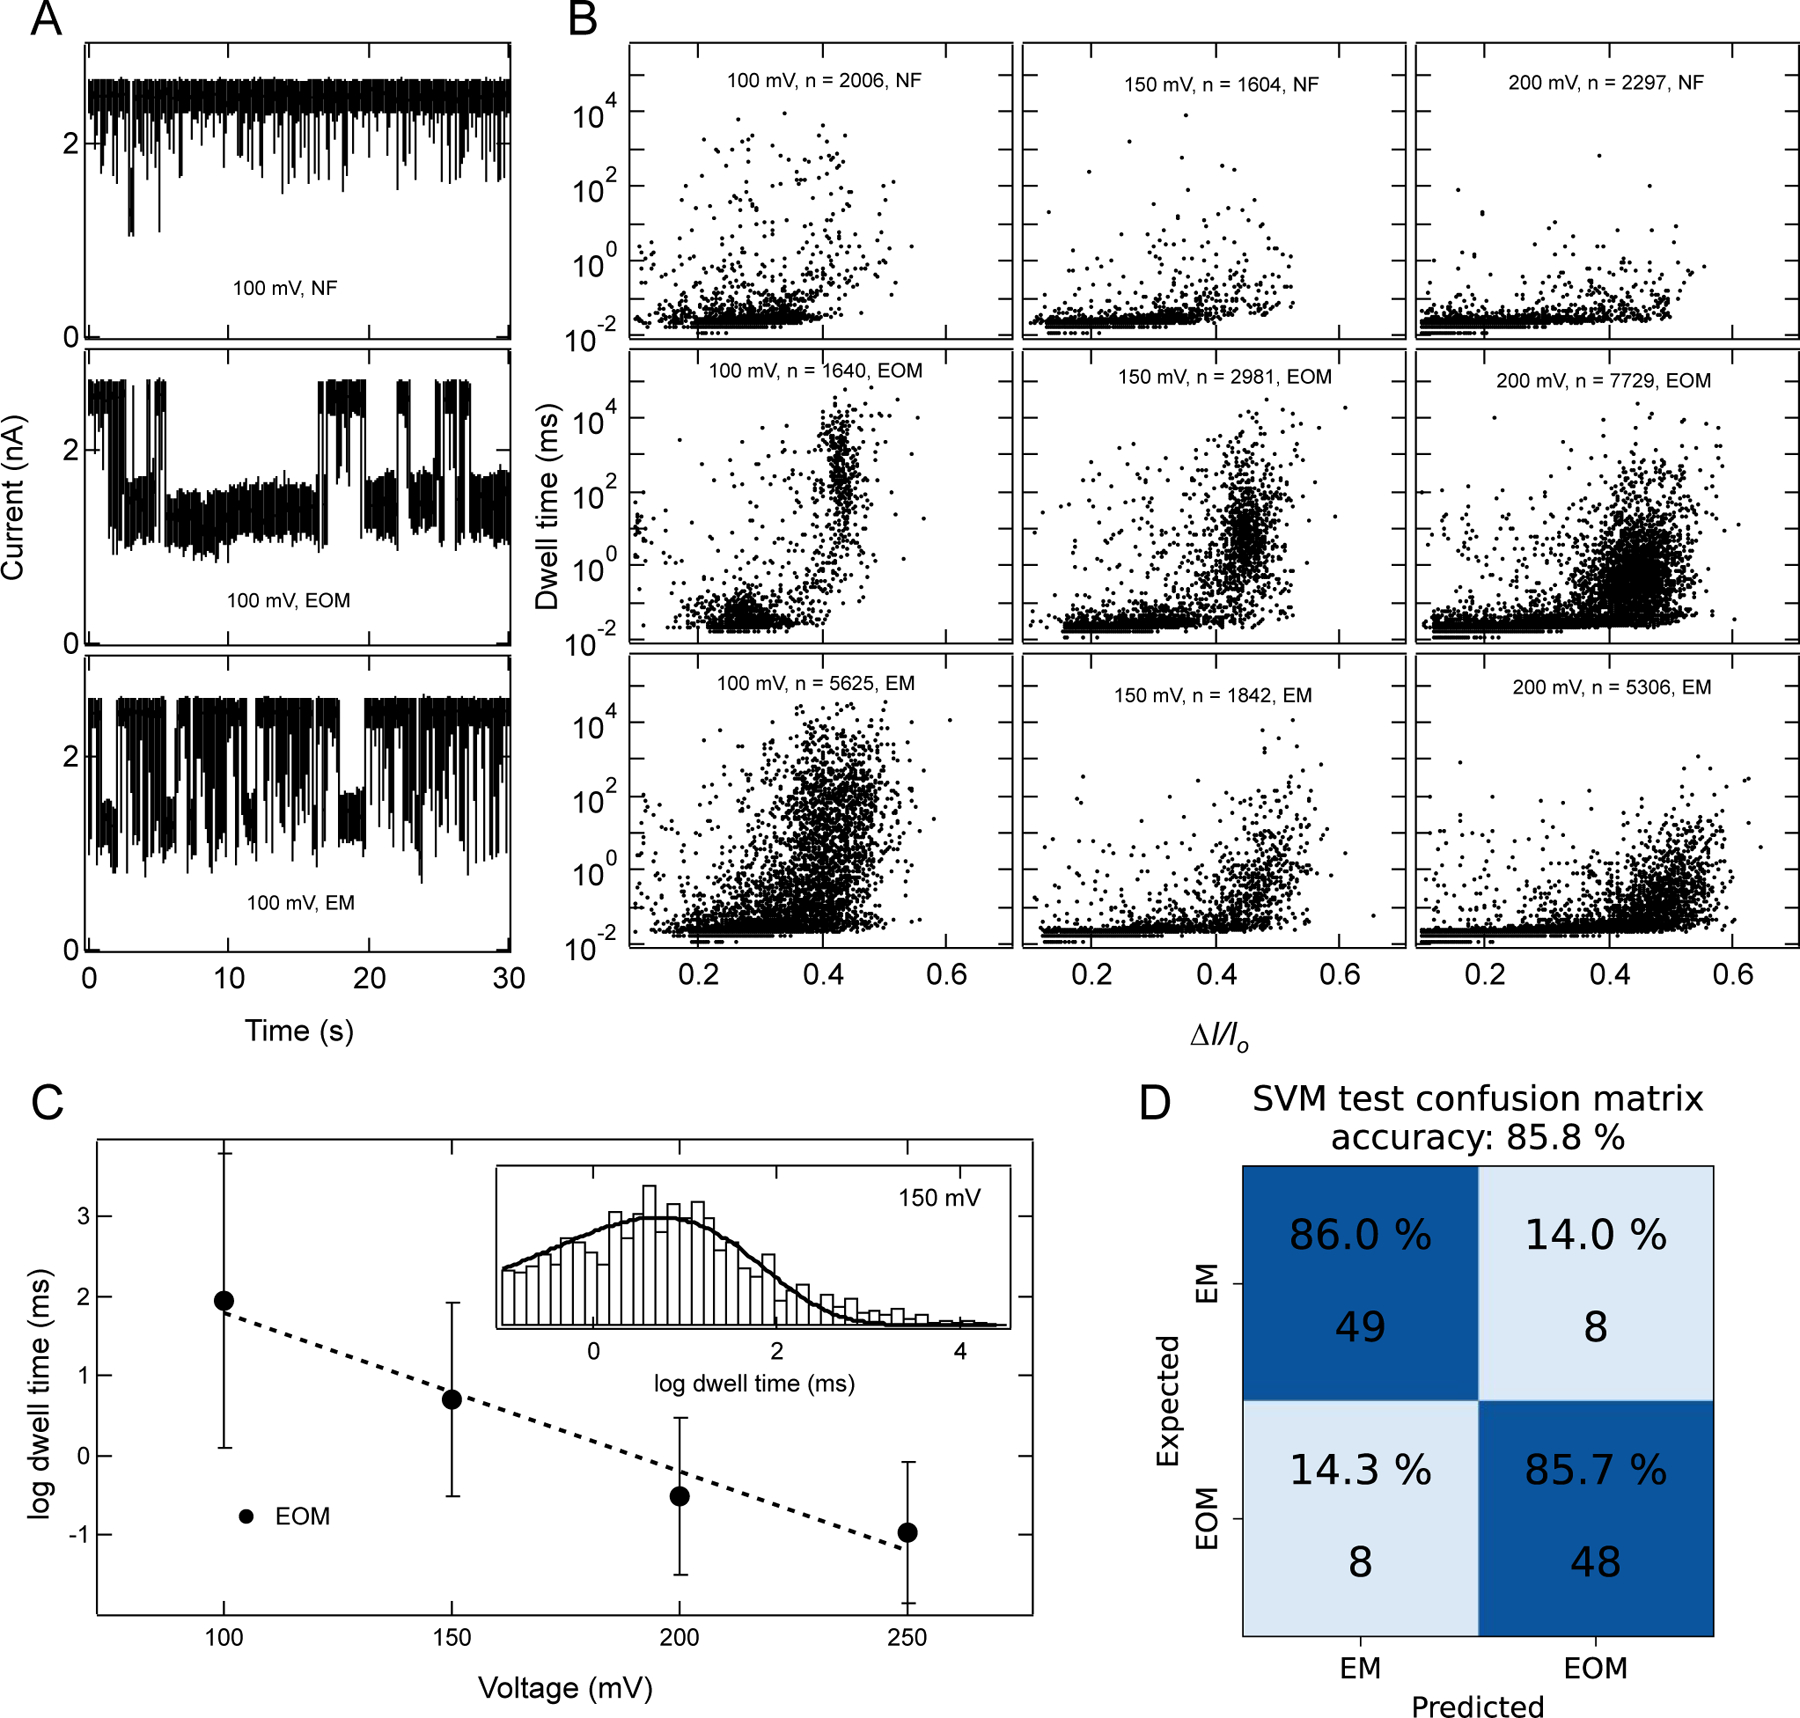
Figure 3.

Characterization of RNA fibers using a 6 nm diameter pore. (A) Example ionic current traces for 100nM of NF, EOM, and EM fibers. Traces shown here were recorded in 1 M KCl, 10 mM HEPES, 2 mM MgCl2, pH 7.5, with a sampling rate of 250 kHz, and 100 kHz filter. (B) Scatter plots of each fiber at different voltages and number of events (n) collected for each scatter plot are indicated in each panel. These plots clearly distinguish between three fiber structures and indicate the rapid passage of fibers as voltage is increased. At 100 mV, a wider distribution of blockade events for EM fibers indicates the mixture of populations of events which corresponds to partial translocations and full translocation. Upon increasing the voltage bias, the distribution shifts towards a higher value of ∆I/Io and faster dwell time, suggesting more fractions of event with full translocation, as full translocation causes more current blockades. (C) log dwell time of EOM as a function of voltage. Dotted line is linear fit of the data suggesting exponential dependence of translocation time with voltage. Inset is representative histogram (excluding events faster than 100 μs) at 150 mV and a fit to a Gumbel-like distribution function having form . Error bars in C represents width of the distribution. (D) SVM analysis of current blockade signals identify EOM and EM with 85.8 % accuracy using features described in methods (also see SI: Fig. S12–S14).
