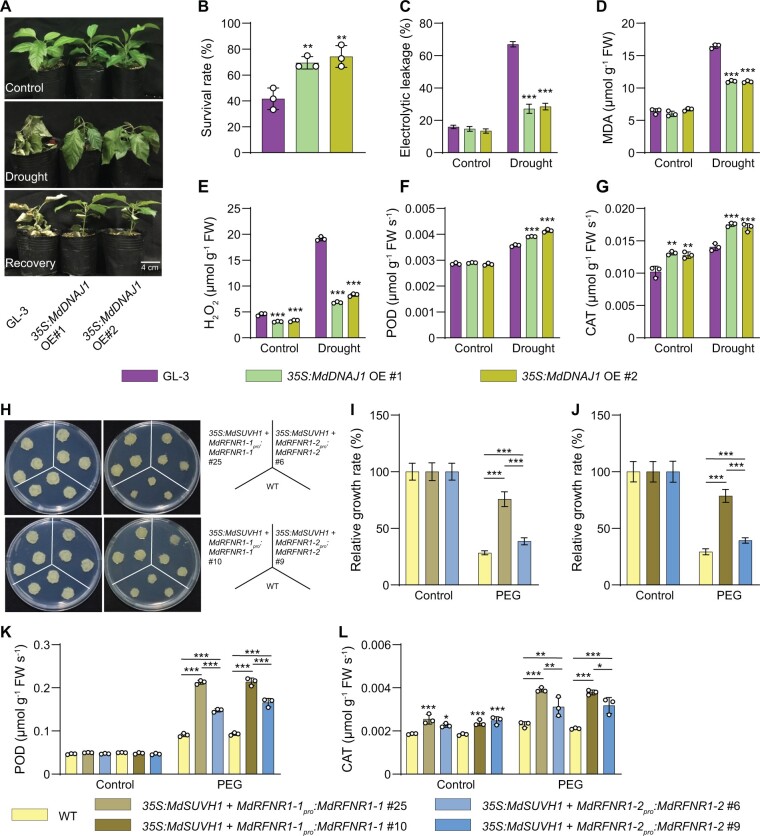
Figure 10.
MdDNAJ1 and MdSUVH1 play positive roles in drought stress tolerance. A, Morphology of GL-3 and transgenic 35S:MdDNAJ1 OE plants under control and drought conditions. Water was withheld from 1.5-month-old plants for 15 days, followed by recovery for 7 days. B, The survival rates of plants shown in (A). C–G, Leaf ion leakage (C), MDA (D) and H2O2 (E) contents, and POD (F) and CAT (G) activities of GL-3 and 35S:MdDNAJ1 OE transgenic plants under control and drought treatment. H, Morphology of WT and transgenic calli, which were co-transformed with 35S:MdSUVH1 and MdRFNR1-1pro:MdRFNR1-1 or MdRFNR1-2pro:MdRFNR1-2 and incubated for 20 days on MS medium (left) or MS medium supplemented with PEG (right). I and J, Relative growth rates of WT and transgenic calli in response to PEG treatment. K and L, POD and CAT activities in WT and transgenic calli in response to PEG treatment. Error bars indicate sd, n = 3 in (D, E, F, G, K, and L), n = 36 in (B, 36 plants were used and divided into three biological replications), n = 8 in (C), and n = 9 in (I and J). Asterisks indicate significant differences between the transgenic lines and GL-3 plants in each group (control and drought treatment). One-way ANOVA (Tukey’s test) was performed and statistically significant differences are indicated by *P ≤ 0.05, **P ≤ 0.01, or ***P ≤ 0.001.

