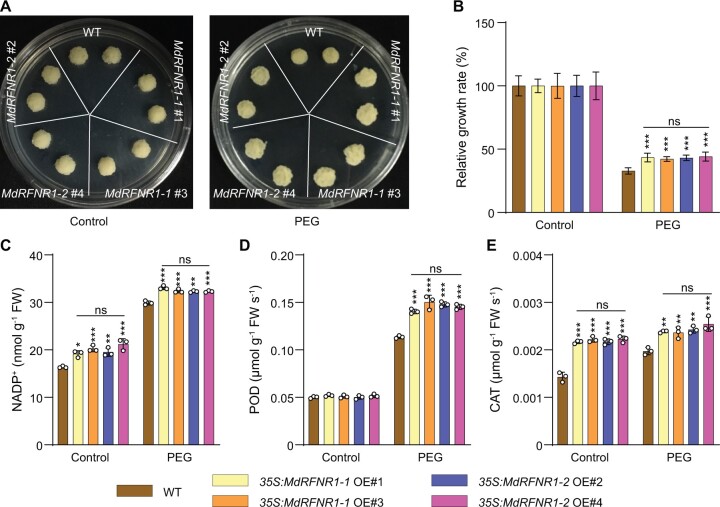
Figure 2.
Two MdRFNR1 variants play the same positive role in plant responses to simulated drought stress. A, Morphology of 35S:MdRFNR1-1 OE, 35S:MdRFNR1-2 OE, and wild-type calli in response to PEG treatment. Calli were cultured on MS medium (left) or MS medium supplemented with PEG (right) for 20 days. B, Relative growth rates of WT, 35S:MdRFNR1-1 OE, and 35S:MdRFNR1-2 OE transgenic calli under control and PEG treatment. Error bars indicate sd, n = 8. C–E, NADP+ contents (C) and POD (D) and CAT (E) activities in response to PEG treatment. WT, wild type. Error bars indicate sd, n = 3. Asterisks indicate significant differences between the transgenic lines and the WT in each group (control or PEG treatment). One-way ANOVA (Tukey’s test) was performed and statistically significant differences are indicated by *P ≤ 0.05, **P ≤ 0.01, or ***P ≤ 0.001. ns, no significant difference.

