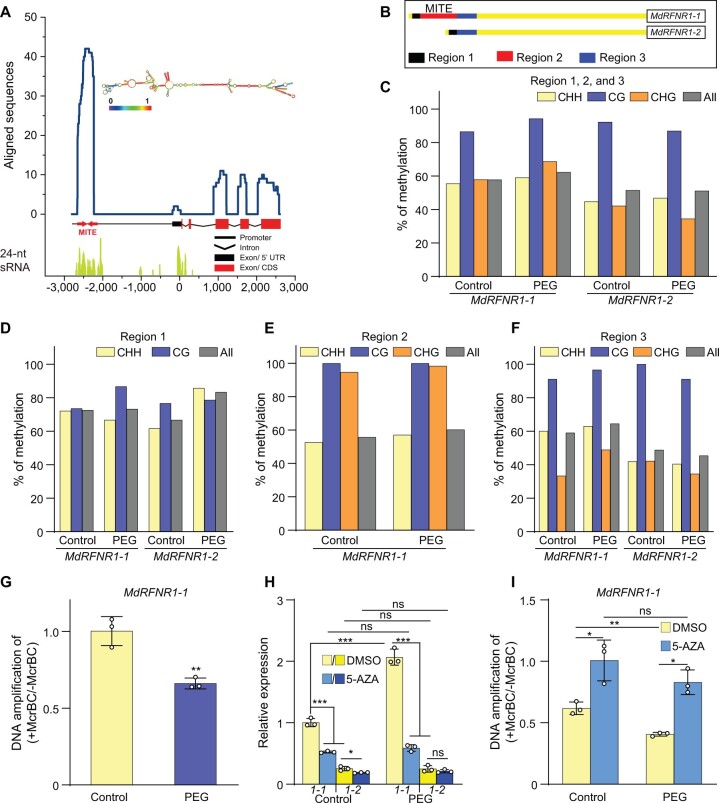
Figure 8.
DNA methylation of the MITE-MdRF1 insertion in the MdRFNR1-1 promoter is positively associated with MdRFNR1-1 expression in response to simulated drought. A, Enrichment of stem–loop structure RNA and 24-nt sRNAs in the MITE-MdFR1 region of the MdRFNR1-1 promoter. The line chart represents the alignment of the MdRFNR1-1 locus (−2,798 to 2,584 bp) against an apple ESTs database. The EST reads with the highest similarity to MITE-MdRF1 were used for structural analysis, which was predicted using the ViennaRNA Web servers (http://rna.tbi.univie.ac.at/). For alignment of 24-nt sRNAs, reads of 24-nt small-RNAs were mapped to the MdRFNR1-1 locus. B, Schematic representation of locus-specific BS-seq analysis in (C–F). Region 1, upstream of MITE-MdRF1 in the MdRFNR1-1 promoter or the corresponding fragment of the MdRFNR1-2 promoter; Region 2, MITE-MdRF1; Region 3, downstream of MITE-MdRF1 in the MdRFNR1-1 promoter or the corresponding fragment of the MdRFNR1-2 promoter. C–F, The methylation percentage of Regions 1, 2, and 3 (C); Region 1 (D); Region 2 (E); and Region 3 (F) of the MdRFNR1 promoter in GL-3 leaves in response to simulated drought stress. G, McrBC–qPCR showing the DNA methylation level of MITE-MdRF1 in the MdRFNR1-1 promoter in GL-3 leaves under control and PEG treatment. Leaves were collected from 4-month-old hydroponically cultured GL-3 plants that were treated with 20% PEG8000 for 0 or 6 h, and locus-specific BS-seq (C–F) or McrBC-qPCR (G) was then performed. H and I, Allelic expression of MdRFNR1-1 and MdRFNR1-2 (H) and DNA methylation level of MITE-MdRF1 in the MdRFNR1-1 promoter (I) in leaves of GL-3 plants treated with DMSO or 5-AZA in response to simulated drought. 1-1 and 1-2 in (H) represent MdRFNR1-1 and MdRFNR1-2, respectively. Subcultured GL-3 plants were transferred to MS medium supplemented with 7 μg/mL 5-AZA or DMSO for an additional 3 weeks, treated with 20% PEG8000 (w/v) for 0 or 6 h, and the leaves were harvested. Error bars indicate sd, n = 3. Statistical analyses were performed by Student’s t test and statistically significant differences are indicated by *P ≤ 0.05, **P ≤ 0.01, or ***P ≤ 0.001. ns, no significant difference.

