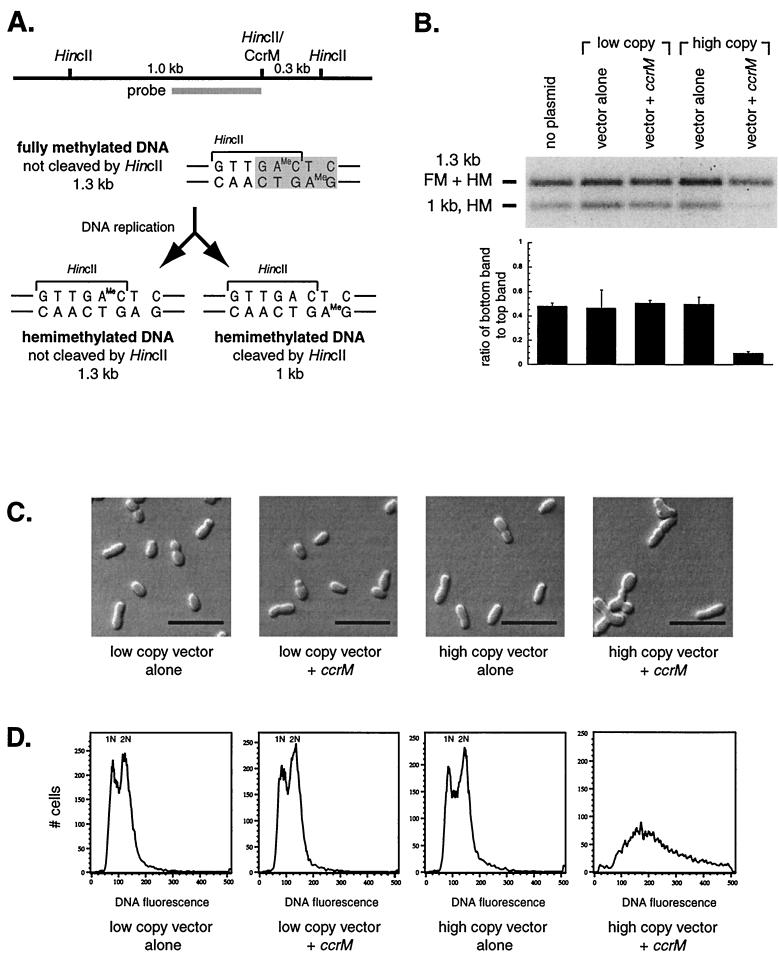
FIG. 2.
Overexpression of the ccrM homolog leads to an increase in the methylation of chromosomal DNA. (A) Schematic of the DNA methylation assay. CcrM methylates adenine in the sequence GANTC (shaded). This CcrM site overlaps the HincII restriction enzyme recognition site GTTGAC in the att locus. If the DNA is fully methylated by CcrM, HincII will not be able to cleave it. However, once this DNA is replicated, each replication product will be hemimethylated, as shown below. The top strand is methylated in one product (left); the bottom strand is methylated in the other product (right). Only one of these two replication products can be cleaved by HincII, as shown. Southern blotting with the probe shown will yield a 1.3-kb band or a 1-kb band, depending on the methylation state of the DNA. (B) Methylation state of the A. tumefaciens A348 DNA in strains carrying different plasmids, using the differential HincII cleavage assay described for panel A. Genomic DNA from mixed cultures in exponential-phase growth was digested with HincII. The low-copy-number vector is pRK290(20R); the low-copy-number vector with ccrM is pLK308 [pRK290(20R) with ccrM]; the high-copy-number vector is pJS71; the high-copy-number vector with ccrM is pLK309 (pJS71 with ccrM). The upper band contains fully methylated (FM) DNA and the hemimethylated (HM) DNA diagrammed on the left in panel A, while the lower band contains the hemimethylated DNA diagrammed on the right. Shown directly below is the ratio between bands for each lane of the gel. (C) Light microscopy of A. tumefaciens A348 carrying different plasmids, which are detailed for panel B above. Bar, 5 μm. (D) Flow cytometry of the strains in panel C. The y axis represents the number of cells with a given fluorescence intensity. The x axis shows the fluorescence intensity, which corresponds to DNA content.

