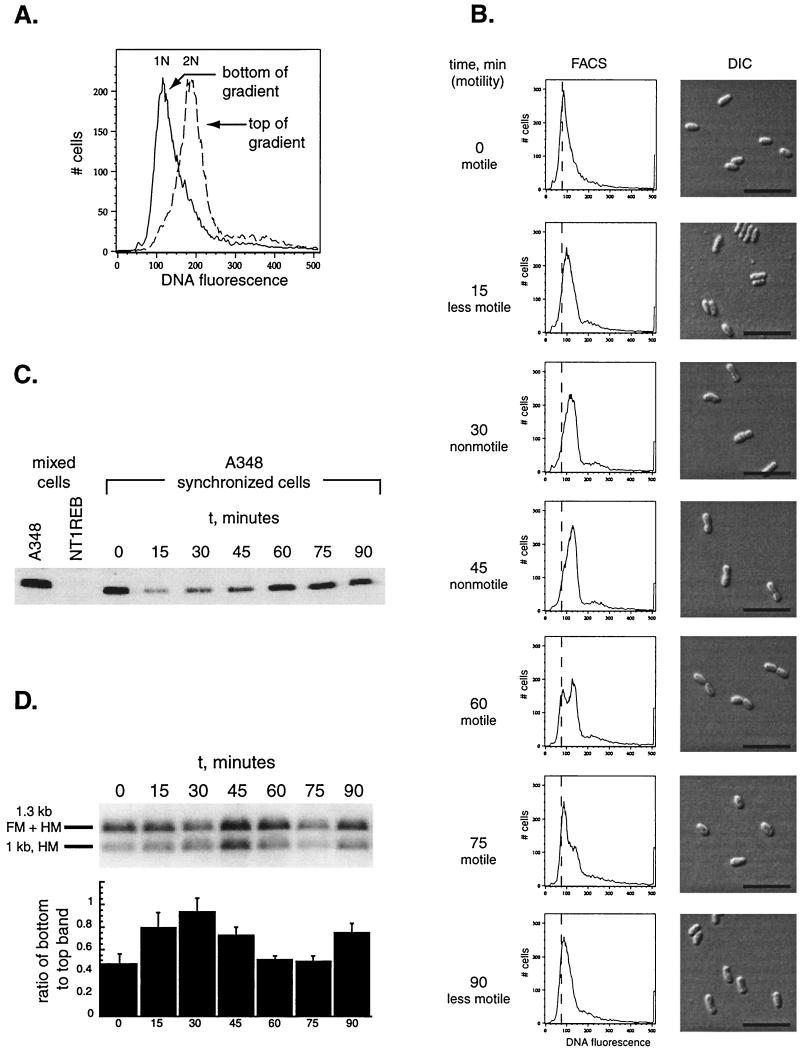
FIG. 4.
A. tumefaciens A348 can be synchronized, and the methylation state of the chromosome varies as a function of the cell cycle. (A) Cells were separated using density centrifugation, as described in Materials and Methods. Flow cytometry of the cells isolated from the bottom and the top of the gradient is shown. (B) The cells from the bottom of the gradient were isolated and allowed to grow as described in Materials and Methods. The changes in motility are indicated; DNA content, as assessed by flow cytometry, and cell morphology over time are shown. The assessment of motility reflects the behavior of the majority of the cell population, as observed by light microscopy, at the time the sample was taken. A vertical line has been arbitrarily placed at 75 fluorescence units on the x axis to aid in following the relative positions of the peaks over the course of the experiment. Bar, 5 μm. (C) Western blot of A. tumefaciens flagellin proteins using polyclonal antiserum to Caulobacter flagellins. The specific 32- to 33-kDa band is shown. Mixed cell populations from both wild-type (A348) and flagellin-negative (NT1REB) cells are shown in the first and second lanes as positive and negative controls. The remaining lanes track the flagellins over the course of the cell cycle in A348. (D) Genomic DNA was prepared from cells at the time points shown in panel B, and the methylation state of the att locus was assayed as described in Materials and Methods and for Fig. 2. A ratio of one between the bottom band and the top band corresponds to 100% hemimethylation of the DNA.

