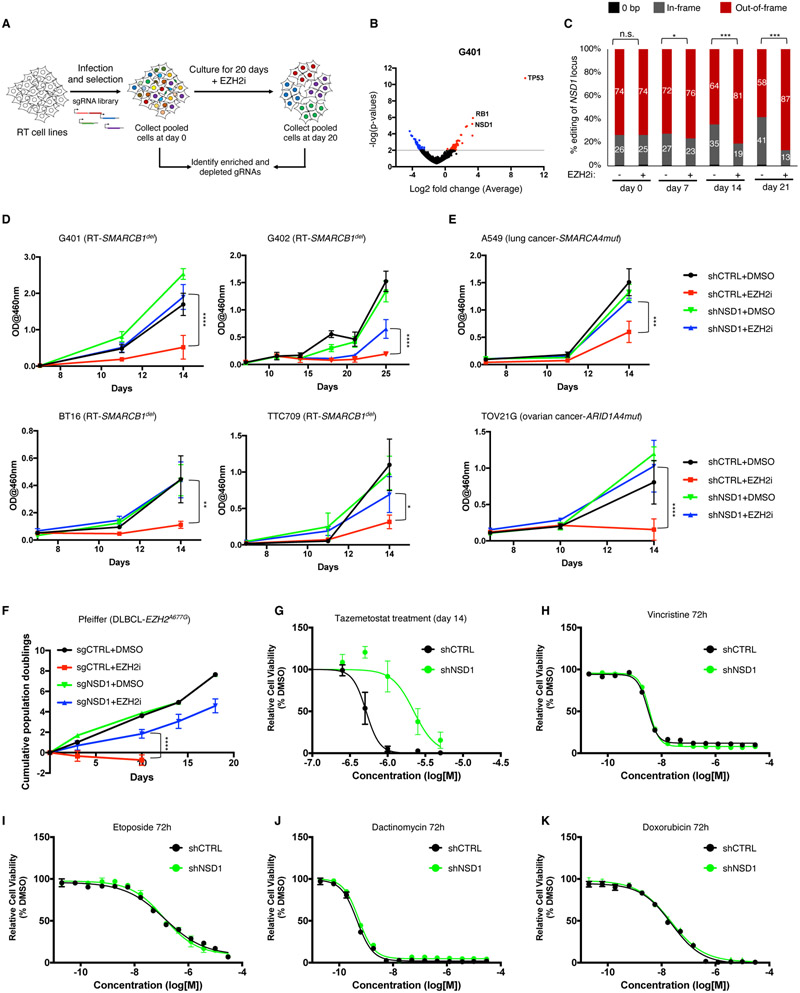
Figure 1. NSD1 loss confers resistance to EZH2 inhibition.
(A) Schematic overview of the CRISPR screen.
(B) Differential enrichment of gRNAs in the CRISPR-Cas9 screen of EZH2i treated G401 cells. The x-axis represents the log fold change of targets based on averaged sgRNA abundance at day 20 vs. day 0 in the presence of GSK126. Positive (red) values represent genes that when deleted provide resistance to GSK126 whereas negative (blue) values represent gene deletions that sensitize cells to GSK126 treatment. The screen was performed with two RT cell lines (G401 and G402) with n=3 biological replicates.
(C) CRISPR-based competitive fitness. NSD1 was targeted with sgRNA in G401 cells and genomic DNA sequenced after 0, 7, 14- and 21-days treatment with GSK126. All indels were binned into in-frame, out-of-frame, or 0-bp. Student’s t-test,*=<0.01, ***=<0.0001, n=3 biological replicates.
(D and E) Proliferation curves of RT (D) and non-RT SWI/SNF mutant (E) cell lines after NSD1 knockdown and treatment with EZH2 inhibitor GSK126. Proliferation was assessed by a modified MTT assay (MTS).
(F) Proliferation of the Pfeiffer lymphoma cell line after NSD1 KO and treatment with either DMSO or GSK126. Proliferation was assessed by cell counting.
(G) Sensitivity of G401 NSD1 KO cell lines to EZH2 inhibitor Tazemetostat.
(H-K) Proliferation of G401 control and NSD1-depleted cells after treatment with standard of care therapeutics vincristine (H), etoposide (I), dactinomycin (J) and doxorubicin (K). Proliferation was assessed by Cell Titer Glo assay at 72 hours of treatment.
For all viability assays, two-way Anova with Turkey’s test for multiple hypothesis correction was used. Error bars represent means ±s.d. (n=2-3 biological replicates, 3 technical replicates). *p < 0.05; **p < 0.01; ***p < 0.001.

