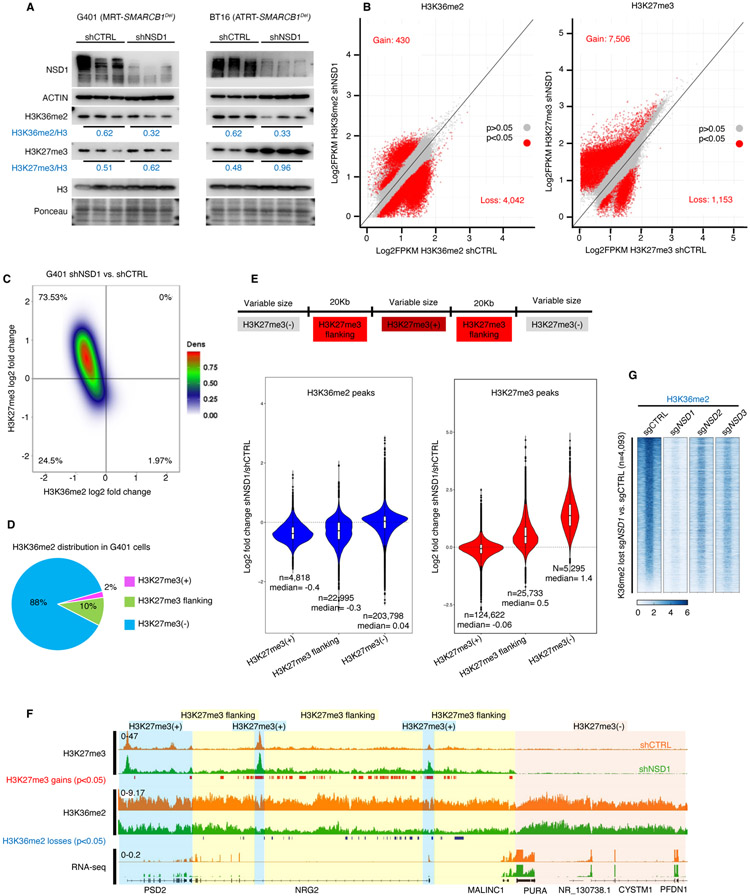
Figure 2. NSD1 depletion leads to H3K36me2 loss and concomitant expansion of H3K27me3 domains.
(A) Immunoblot analysis of G401 and BT16 RT cells upon NSD1 knockdown, with quantification of histone marks normalized to total H3.
(B) Scatter plot analysis of sites differentially enriched for H3K36me2 and H3K27me3 in ChIP-seq analyses of G401 cells subject to NSD1 knockdown. Significance computed using empirical Bayesian statistical tests and linear fitting, see methods for details.
(C) Density plot analysis using 10Kb window segmentation to reveal the relationship between sites of change in H3K27me3 and H3K36me2 upon NSD1 knockdown in G401 RT cells. The genome was segmented into 10Kb bins, and the log2 fold changes were calculated. The plot represents log2 fold change of H3K36me2 and H3K27me3 signal in 10Kb windows.
(D) H3K36me2 distribution in H3K27me3-defined genomic regions. The genome was classified into 3 groups based on H3K27me3 levels in shCTRL cells (see text for details). H3K36me2 signal across four conditions (shCTRL G401, shNSD1 G401 +/− EZH2 inhibitor, see methods) was defined and assigned to H3K27me3-based domains.
(E) Violin plots show differentially enriched H3K36me2 and H3K27me3 peaks (log2 fold change) in shNSD1 vs. shCTRL G401 cells, in each H3K27me3-based domain.
(F) Genome browser tracks for H3K27me3 and H3K36me2 in G401 RT cells treated with shCTRL or shNSD1. Significant H3K27me3 gains (red) and H3K36me2 losses (blue) are depicted. Blue shaded domain=H3K27me3(+), yellow=H3K27me3(+) flanking and pink=H3K27me3(−) domains
(G) Region-scaled heatmap visualization of H3K36me2 normalized ChIP-seq coverage, rank-ordered based on losses in sgNSD1 vs. control G401 cells, including averaged normalized coverage for sgNSD2 and sgNSD3 cells (n=2).

