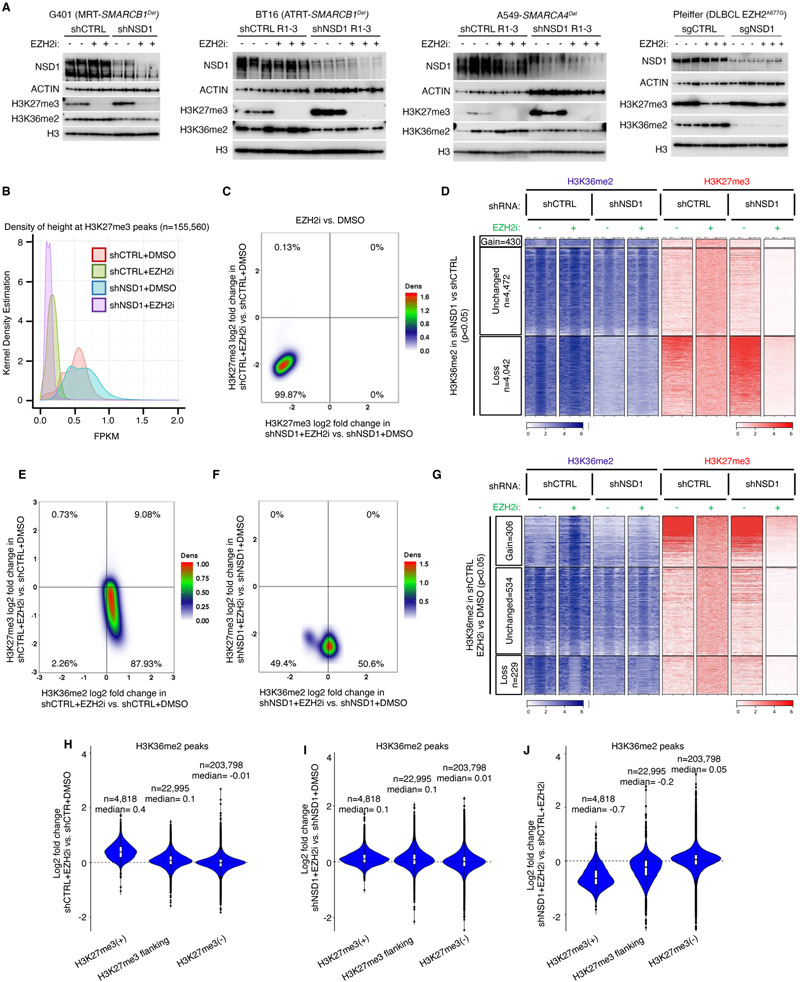
Figure 3. H3K27me3 erasure by EZH2 inhibition is independent of NSD1.
(A) Immunoblot analysis of either control or NSD1 depleted G401 (RT), BT16 (RT), A549 (SMARCA4Del) and Pfeiffer (EZH2 hypermorph) cells upon EZH2 inhibition.
(B) Kernel density plot of H3K27me3 density (fragment length per kilobase/million read (FPKM)) for control and NSD1 depleted cells EZH2 inhibition.
(C) Density plot showing the relationship between the genome-wide changes in H3K27me3 in control vs NSD1 depleted cells upon EZH2 inhibition, using 10kb genome segmentation analysis. Each dot is a 10-Kb window with x/y-axis as log2 fold change.
(D) Region scaled heatmap of H3K36me2, and H3K27me3 ChIP-seq data, of H3K36me2 peaks +/− 3Kb and grouped by changes in K36me2 upon NSD1 knockdown. Significance computed using empirical Bayesian statistical tests and linear fitting, see methods for details.
(E and F) Density plots of relationship between genome-wide changes in H3K27me3 and H3K36me2 using genome segmentation analysis in control (E) and NSD1 depleted (F) cells upon EZH2 inhibition.
(G) Region scaled heatmap visualization of H3K36me2 and H3K27me3 ChIP-seq data, of the H3K36me2 peak regions +/− 3Kb and grouped by changes upon EZH2 inhibition in shCTRL cells. Significance computed using empirical Bayesian statistical tests and linear fitting, see methods for details.
(H-J) Violin plots show differentially enriched H3K36me2 peaks (log2 fold change) in either G401 control (H), NSD1 depleted (I) or both (J), upon EZH2 inhibition, in each H3K27me3-based domain.
For all EZH2 inhibition experiments, cells were treated with either DMSO or 1uM GSK126 for 3 days.

