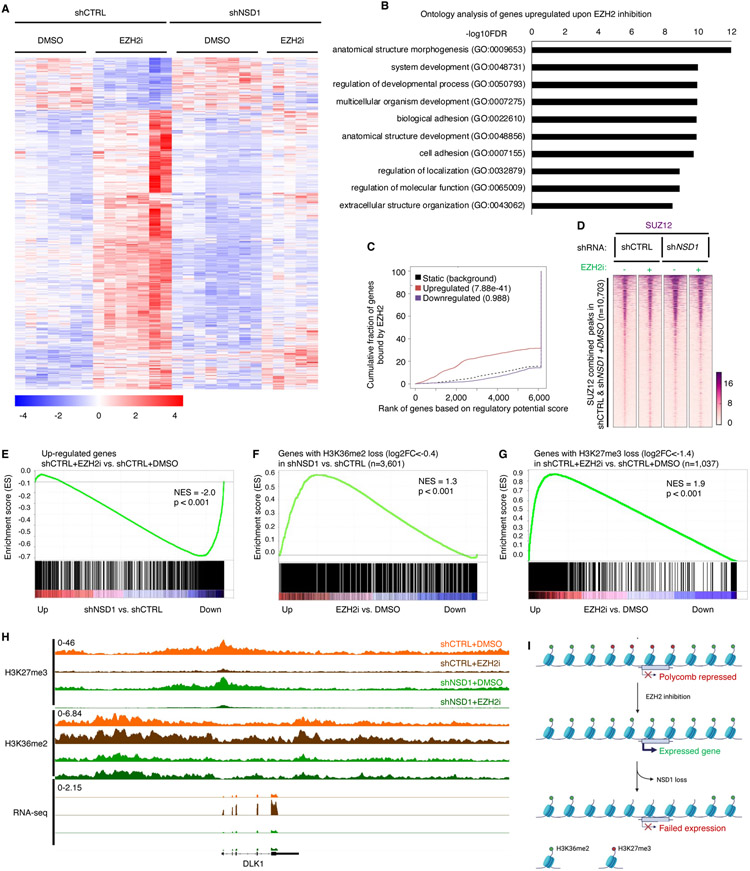
Figure 4. Transcriptional de-repression following EZH2 inhibition depends on NSD1.
(A) Heatmap of 1,041 differentially expressed genes (789 Up, 252 Down, log2 fold change>0 or<0, adjusted p value <0.05, significance computed using empirical Bayesian statistical tests and linear fitting) in control or NSD1 depleted G401 cells upon EZH2 inhibition. Each column represents a biological replicate and rows are hierarchically clustered based on gene expression z-scores (see methods for details).
(B) Gene ontology analysis of the 789 genes upregulated upon EZH2 inhibition in control G401 cells in (A). Only the top 10 out of the 363 total pathways with FDR<0.05 are shown.
(C) Binding and expression target analysis (BETA) of genes upregulated upon EZH2 inhibition and bound by EZH2 in untreated control cells. Each gene is assigned a regulatory potential score based on its expression and binding by EZH2. The red and blue lines represent genes up and down regulated upon EZH2 inhibition, respectively. The dashed line represents genes unchanged or static upon EZH2 inhibition and represent the background. Genes are aggregated based on the “regulatory potential score” and ranked from high to low. P-values are calculated using the Kolmogorov-Smirnov test.
(D) Peak centered heatmap of SUZ12 normalized ChIP-Seq coverage, rank-ordered based on peak signal in untreated control and NSD1 depleted cells (n=1 replicate).
(E) Preranked GSEA using a gene set defined as genes up-regulated (adjusted p-value < 0.05 and log2FC > 0) upon EZH2 inhibition, compared to log2FC ranked genes differentially expressed after NSD1 depletion.
(F and G) Preranked GSEA using a gene set defined as genes losing (log2FC < −0.4) H3K36me2 upon NSD1 depletion (F) or EZH2 inhibition (G) compared to log2FC ranked genes differentially expressed after EZH2 inhibition.
(H) Genome browser tracks depicting H3K27me3, H3K36me2 and RNA-seq reads upon EZH2 inhibition in both control and NSD1 depleted cells.
(I) Schematic representation of the H3K36me2 role in transcriptional activation of Polycomb repressed genes upon EZH2 inhibition.
For all EZH2 inhibition experiments, cells were treated with either DMSO or 1uM GSK126 for 3 days. For GSEA analysis, statistics were calculated by the GSEA tool ( methods for details). NES=normalized enrichment score.

