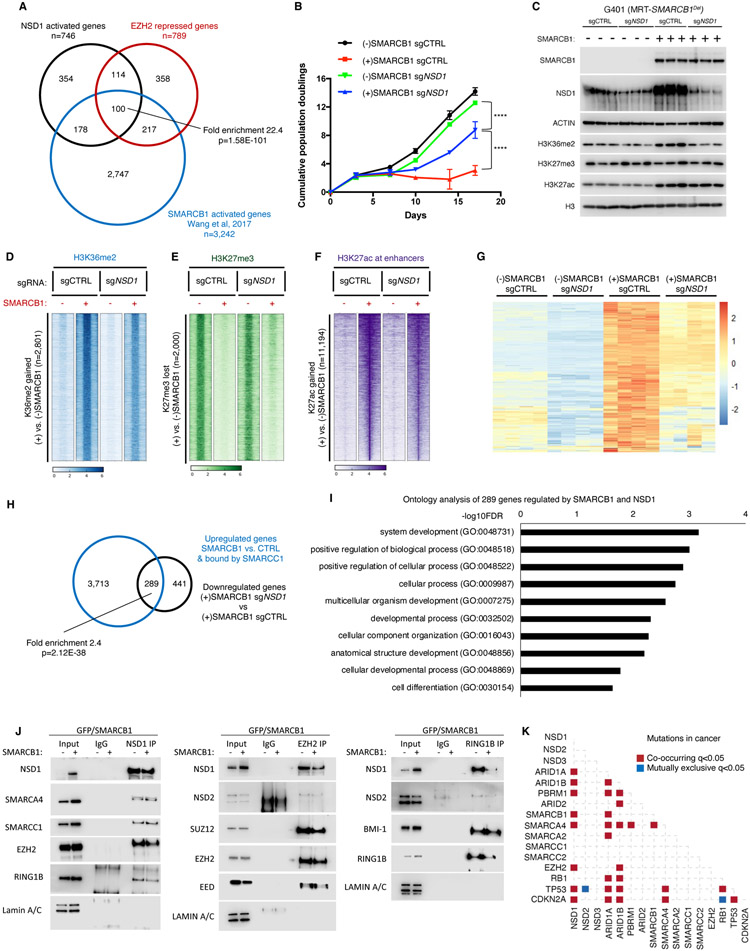
Figure 5. NSD1 cooperates with SWI/SNF to activate transcription and induce differentiation.
(A) Analysis of intersection between genes downregulated in shNSD1 vs. shCTRL, upregulated upon SMARCB1 addback + bound by SMARCC1, and upregulated upon EZH2 inhibition by Venn diagram and enrichment statistics (p-value computed using standard Fisher’s exact Test for pairwise overlaps and “Exact Test of Multi-set Intersections” for multi-list overlaps).
(B) Proliferation assays for G401 control and SMARCB1 cells with and without NSD1.
(C) Immunoblot analysis of G401 isogenic cell lines ectopically expressing GFP or SMARCB1.
(D-F) Region-scaled heatmap visualizations of normalized ChIP-Seq coverage, rank-ordered based on changes in SMARCB1-induced G401 cells vs control cells depicting sites of H3K36me2 gain (D), H3K27me3 loss (E) and H3K27ac gain at enhancers (F). n=2 biological replicates.
(G) Heatmap of the 289 genes that are both upregulated by SMARCB1 addition and downregulated by NSD1 loss. n=4 biological replicates per condition.
(H) Venn diagram of the 4,002 genes upregulated by SMARCB1 and bound by SMARCC1 and the 730 genes downregulated by loss of NSD1. There are 289 genes with significant overlap (Fisher’s exact Test) among the 2 datasets (p=2.12E-38).
(I) Significantly enriched biological processes based on the 289 genes that require NSD1 for upregulation by SMARCB1.
(J) Co-immunoprecipitation analysis of NSD1, EZH2 and RING1B in G401 cells upon SMARCB1 addback and schematic representation of the results. Representative immunoblots from n=2 biological replicates.
(K) Analysis of mutation co-occurrence and mutual exclusivity in cancer patients using cBioportal (see methods for details). Fisher’s Exact Test was used.

