FIGURE 4.
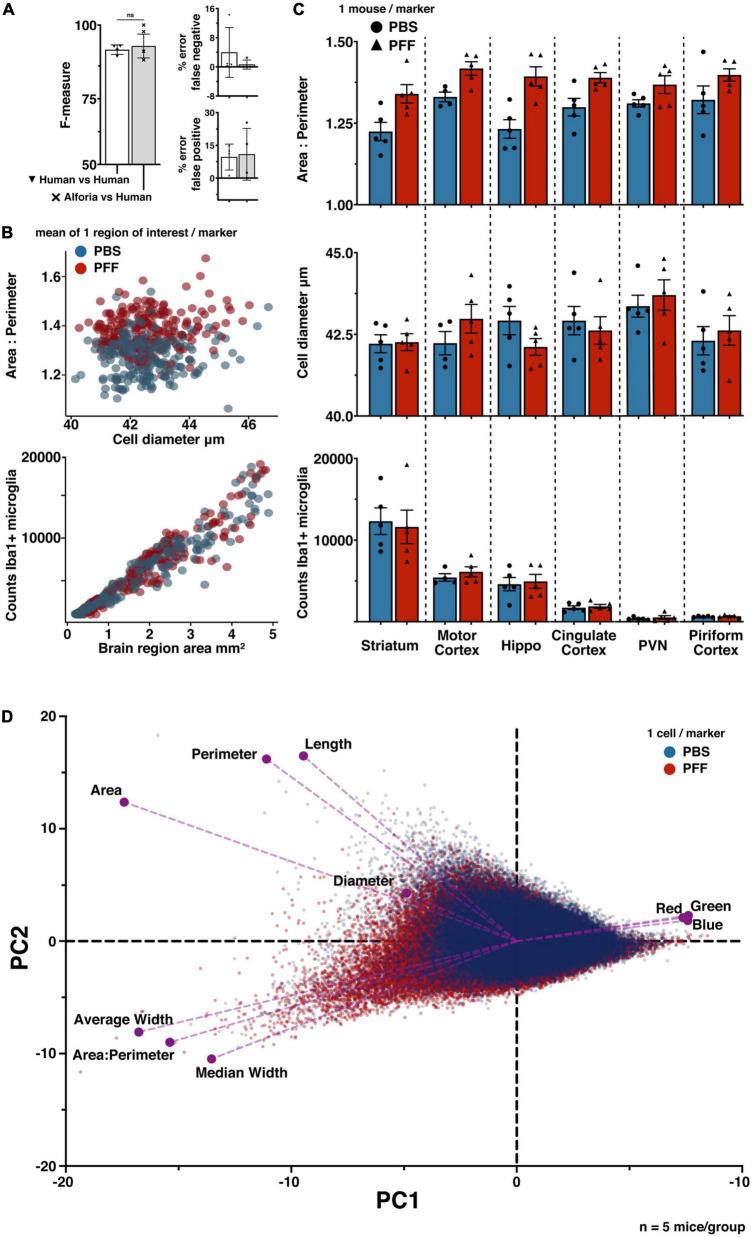
Quantifying microglia activation in a model of striatal αSyn aggregation. (A) Comparison of striatal αSyn aggregation microglia adapted model performance against researchers experienced in microglia histopathology (42 validations regions, 25 images), with no significant differences. (B) PFFs are related to changes in microglia morphology (scatter plot 1), but not the number of cells (scatter plot 2). The number of regions of interest were selected to sample evenly across mice within each brain region. Each marker represents 1 region of interest: cingulate cortex (n = 82), hippocampus (n = 77), motor cortex (n = 75), paraventricular nucleus (PVN) (n = 30), piriform cortex (n = 35), striatum (n = 120). (n = 5 mice/treatment group; regions of interest per group PBS n = 204; PFF n = 220). (C) Comparison of microglia morphology measures across brain regions, suggesting an effect of treatment on microglia morphology but no effect on the number of microglia. Each marker represents one animal, error bars represent within group standard mean errors (n = 5 mice/treatment group). (D) Principal component analysis biplot confirming a treatment specific data separation, with respect to each measure of microglia morphology; area:perimeter, area, perimeter, diameter, color channel values (Red, Green, Blue), length, average width, and median width (PBS n = 120,801; PFF n = 130,906).

