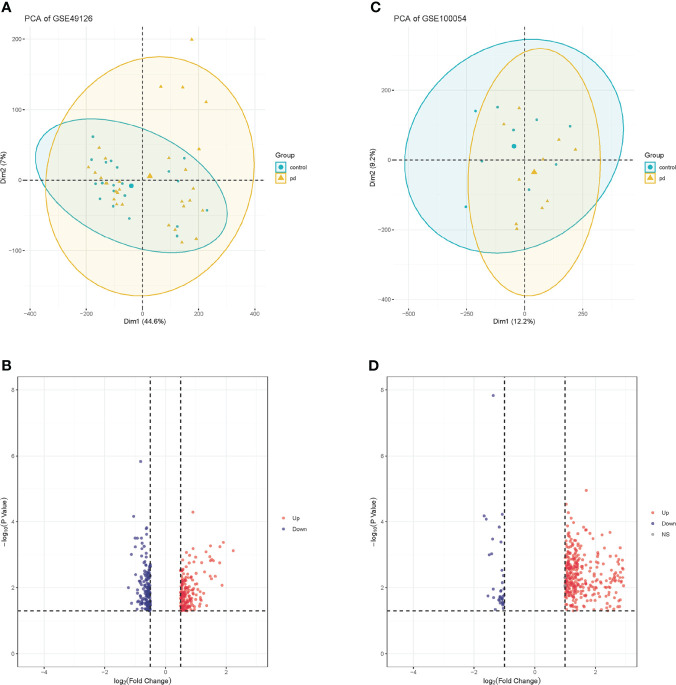
Figure 2.
PCA plots of gene chips and volcano maps of different expression genes. (A) PCA analysis plot of GSE100054 gene chip; (B) Volcano map of GSE100054 gene chip; (C) PCA analysis plot of GSE49126 gene chip; (D) Volcano map of GSE49126 gene chip. Control represents healthy controls, pd represents Parkinson’s disease. Up represents upregulated genes, and down represents downregulated genes.

