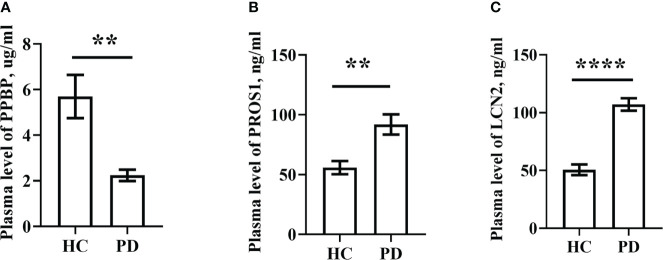
Figure 9.
Plasma levels of PPBP, PROS1 and LCN2 in PD patients (n=69) and healthy controls (n=36). (A) Comparison of the expression levels of plasma PPBP; (B) Comparison of the expression levels of plasma PROS1; (C) Comparison of the expression levels of plasma LCN2. HC represents healthy controls, PD represents Parkinson’s disease. ** P < 0.01, **** P < 0.0001.

