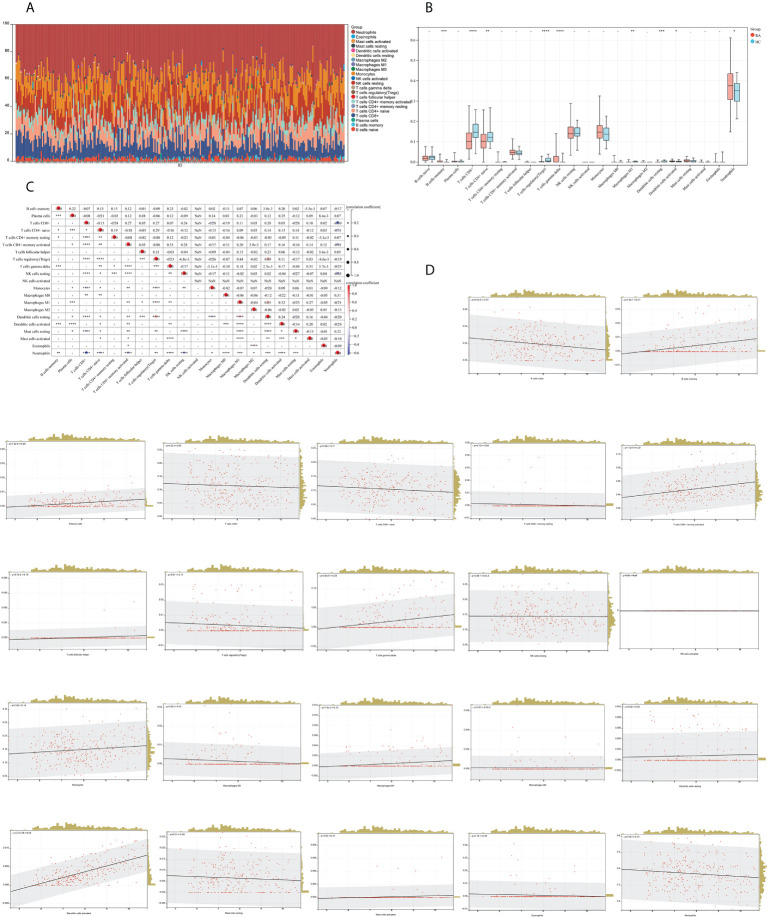
Figure 13.
Analysis of immune cell infiltration. (A) A histogram of the proportion of LM22 in RA samples is depicted using the CIBERSORT algorithm, with the horizontal coordinate representing the sample and the vertical coordinate representing the percentage of individual immune cells. (B) Comparison of immune infiltrating cells between the RA and HC groups; red represents RA and cyan represents HC. (C) Correlation matrix between immune cells within the RA group. The horizontal and vertical coordinates are LM22, with red representing positive correlations and blue representing negative correlations (*P < 0.05, ** P < 0.01, and *** P < 0.001). (D) Correlation analysis between the expression of IFI44 and LM22.

