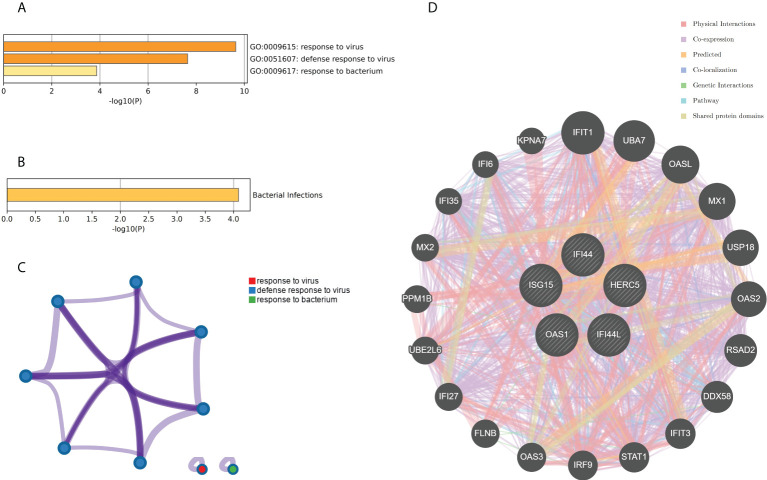
Figure 9.
Functional enrichment analysis: Metascape and GeneMANIA of five hub genes. (A) Pathway and process richness analysis of the Metascape platform. (B) Summary of enrichment analysis of DisGeNET 13 on Metascape platform. (C) The network is visualized using Cytoscape 5, colored by cluster IDs, and nodes sharing the same cluster ID are usually close to each other. (D) The gene–gene interaction network of the five hub genes with the 20 most adjacent genes was analyzed using the GeneMANIA database. Each node represents a gene. The color of the linkage of the nodes represents the linkage between the corresponding genes.

