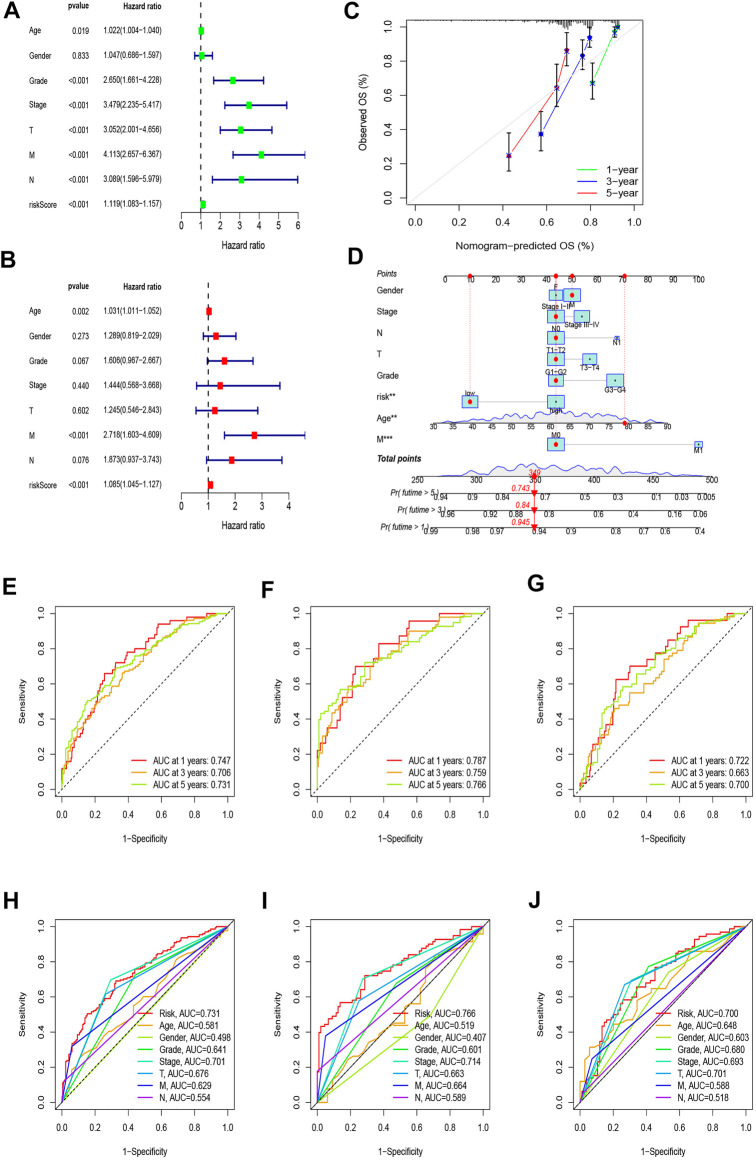
FIGURE 5.
Nomogram and assessment of the risk model. (A,B) Uni-Cox and multi-Cox analyses of clinical factors and risk scores with OS. (C) Calibration curves for 1-, 3-, and 5-year OS. (D) The nomogram that integrated the risk score and clinical parameters to predict the 1-, 3-, and 5-year OS rate. (E–G) ROC curves for the 1-, 3-, and 5-year OS rate of the full, training, and test set, respectively. (H–J) ROC curves for 5-year OS rate of risk score and clinical parameters of the full, training, and test sets, respectively.

