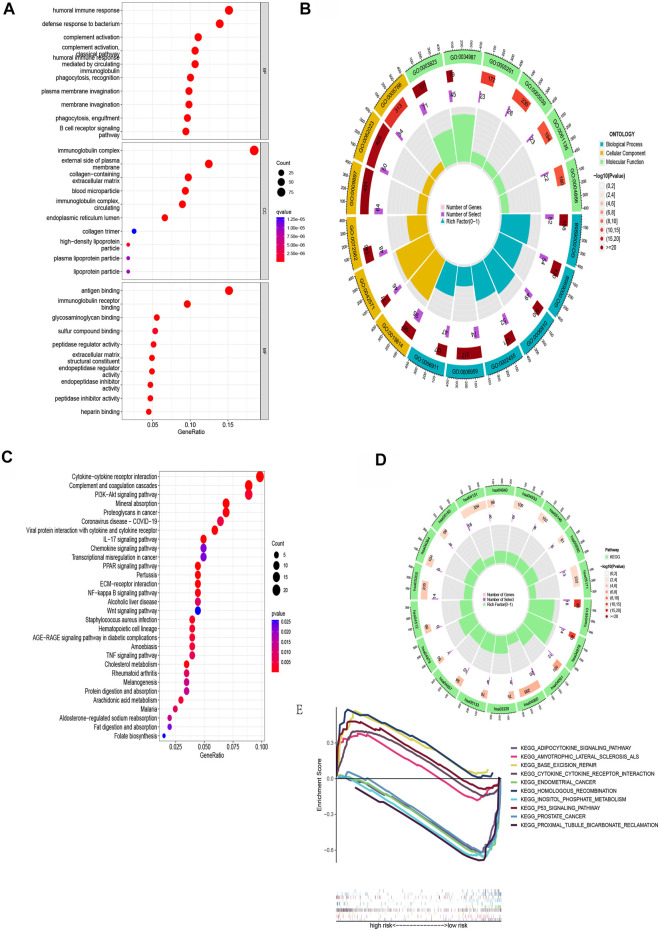
FIGURE 7.
Functional enrichment for differentially expressed BMRGs between the two groups. (A) The top 30 significant terms of GO functional enrichment. (B) The circle diagram enriched in the GO analysis. (C) KEGG functional enrichment’s top 30 significant terms. (D) The circle diagram enriched in the KEGG analysis. (E) GSEA analysis of the top five enrichment pathways in the low- and high-risk groups, respectively.

