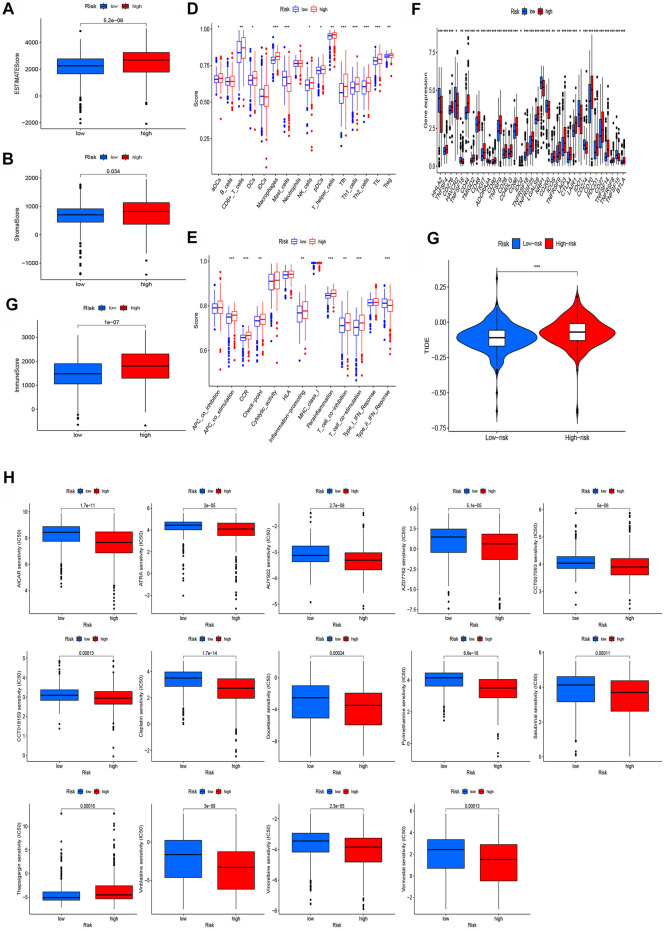
FIGURE 8.
Investigation of tumor immune factors and immunotherapy. (A–C) Comparison of ESTIMATE scores, stromal scores, and immune scores between two groups. (D) Comparison of immune cells between two groups. (E) Comparison of immune functions between two groups. (F) Comparison of checkpoints between the two groups. (G) Comparison of TIE between the two groups. (H) Immunotherapy prediction of 14 drugs in high- and low-risk groups.

