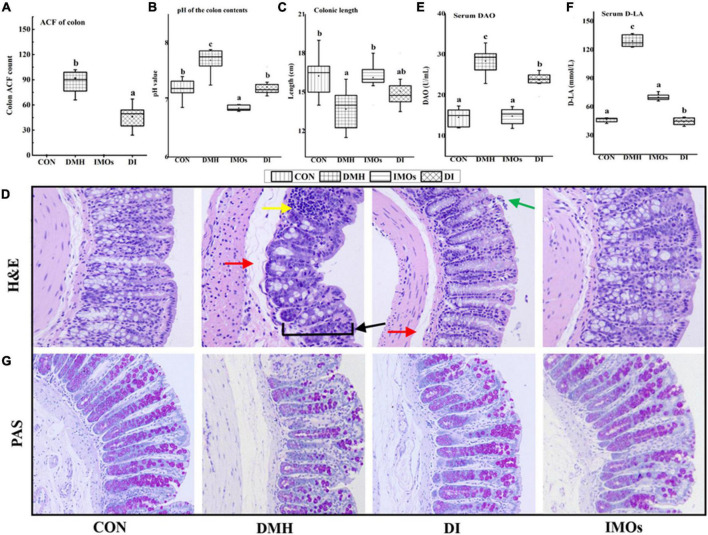
FIGURE 3.
(A) Colon ACF counts among rats in the four groups. (B) Effect of IMOs treatment on pH of colonic contents in rats. (C) Effect of IMOs treatment on colon length in rats. (D) H&E staining of colonic tissue from rats (200× magnification). Effect of IMOs treatment on intestinal permeability in DMH-treated rats. The levels of (E) DAO and (F) D-LA in rat serum and (G) PAS staining of colonic tissue from rats (200× magnification). Values followed by different letters (a, b and c) in each group are significantly different (p < 0.05).

