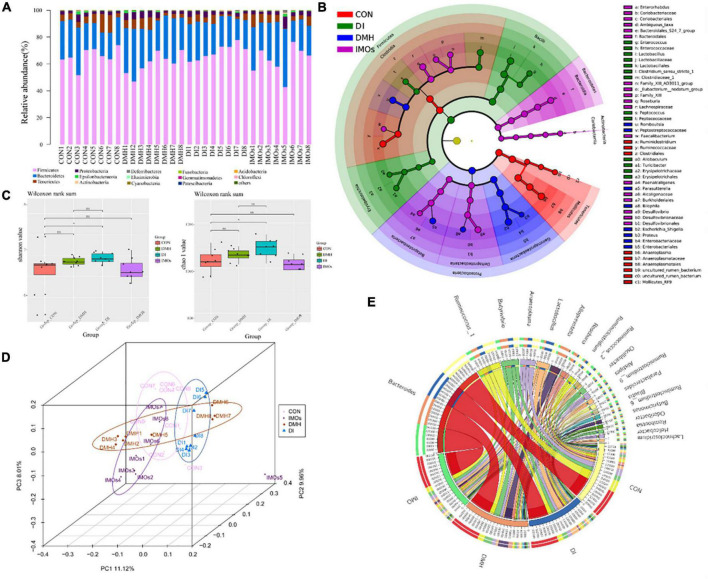
FIGURE 4.
Faecal microbiota effects of DMH treatment after 12 weeks of intervention with or without IMOs diet. (A) Relative abundances of phyla in the different groups. (B) Taxonomic abundance analysis (LEfSe analysis) revealed multiple differentially abundant taxa in different groups of faeces. (C) Microbial richness estimates (Chao index) and diversity indices (Shannon–Wiener) in the different groups. (D) PCoA shows separation of the faecal bacterial compositions among the four groups. (E) The chord diagram reveals the top 25 abundant genera (abundance > 0.1%) in the four groups.

