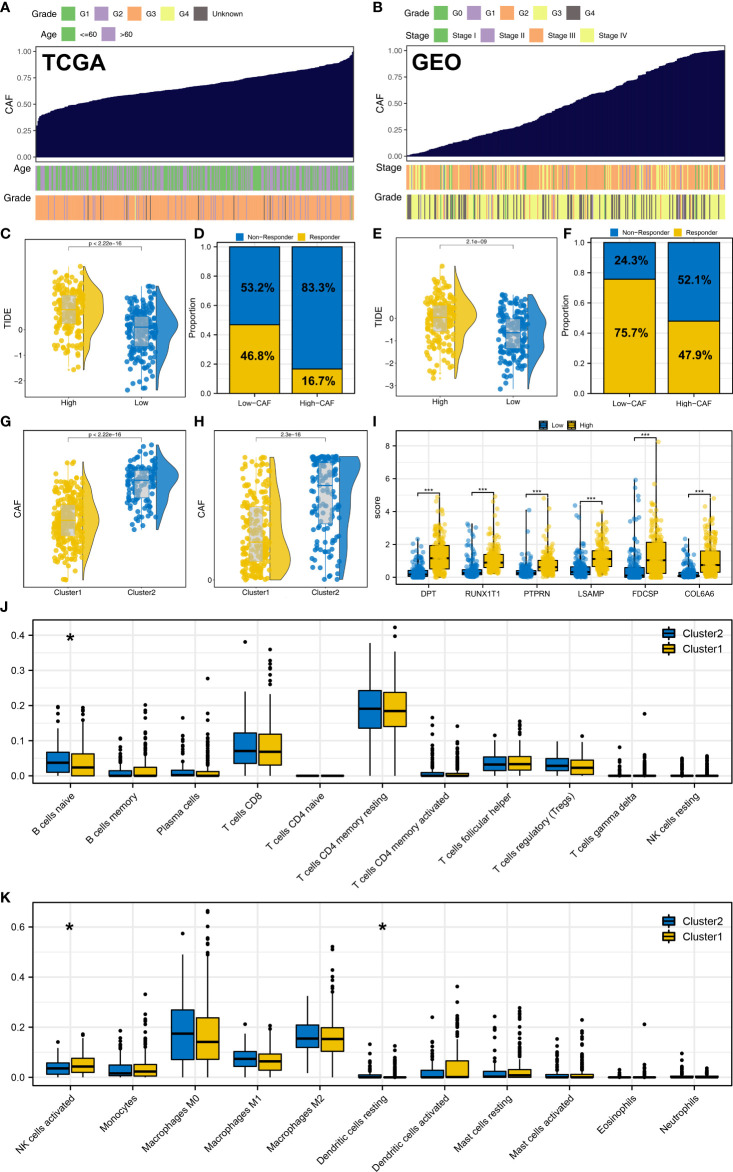
Figure 8.
CAFs is associated with the immunotherapy response of OC. (A, B) ssGSEA algorithm was used to quantify the CAFs infiltration in TCGA and GSE cohorts; (C, D) In TCGA, patients with low CAFs infiltration had a lower TIDE score and a higher proportion of immunotherapy responders; (E, F) In the GEO cohort, patients with low CAFs infiltration had a lower TIDE score and a higher proportion of immunotherapy responders; (G) In TCGA, patients in Cluster2 had a higher CAFs infiltration; (H) In the GEO cohort, patients in Cluster2 also had a higher CAFs infiltration; (I) DPT, RUNX1T1, PTPRN, LSAMP, FDCSP and COL6A6 were upregulated in the patients with high CAFs infiltration; (J, K) Immune infiltration analysis of Cluster1 and Cluster2. * = P < 0.05, *** = P < 0.001.

