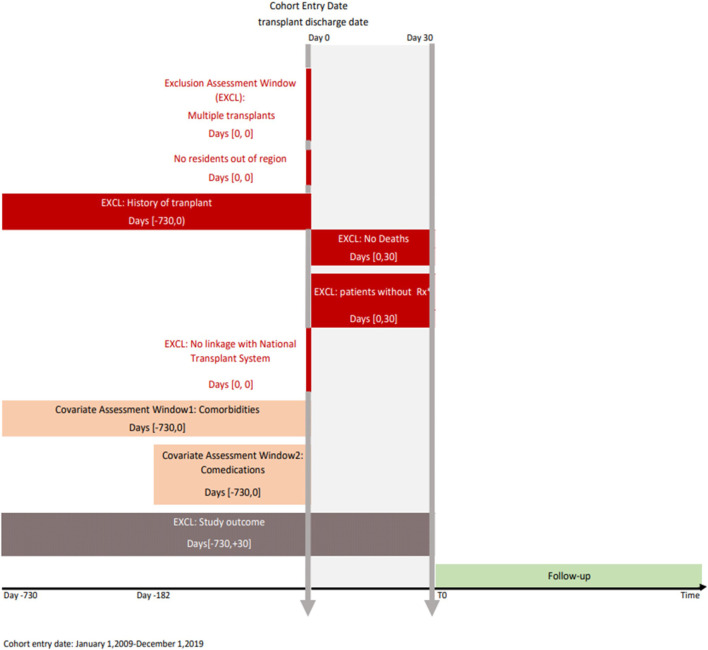
FIGURE 3.
Study design diagram. Note: The study design diagram visually displays study design implementation. The first vertical line represents the cohort entry date (index date) and the second represents the landmark period (30 days). The boxes represent time windows used to perform exclusion or covariate assessment. The brackets in the boxes show time intervals anchored on day 0. Rx, immunosuppressive prescription; EXCL, exclusion.

