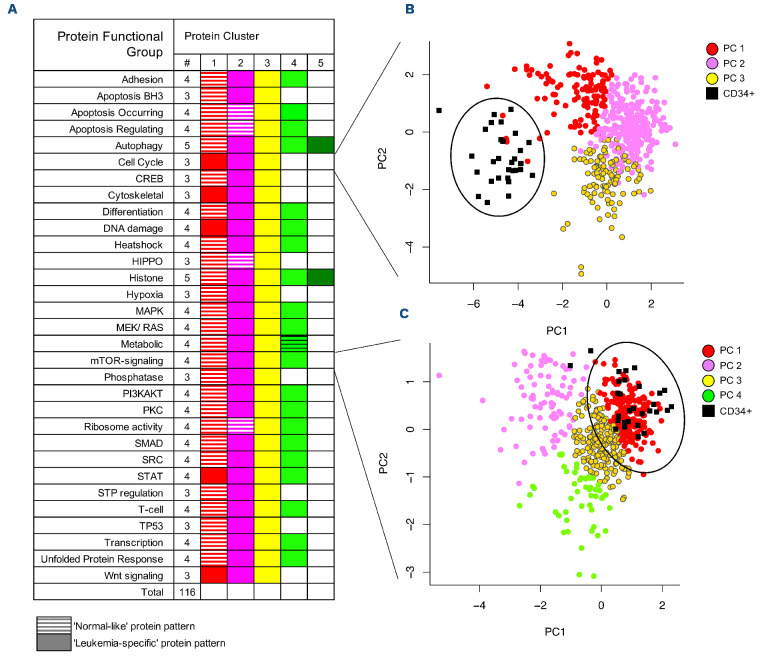
Figure 2.
Protein functional group classification and similarity to that of normal CD34+ cells. (A) The progeny clustering algorithm was applied to the 31 protein functional groups (PFG) and identified an optimal number of protein clusters (PrCL). PrCL were compared with those of normal CD34+ cells using principal component analysis, (PCA) and classified as either “normallike” or “leukemia-like”. “Normal-like” patterns are represented by hatched boxes, “leukemia-specific” patterns by full boxes. (B, C) PCA with each PrCL being assigned to a color within the PFG to illustrate its similarity to, or difference from, normal CD34+ cells. Two examples of PCA mapping include (B) cell cycle and (C) mTOR-signaling Normal CD34+ samples are represented by small black squares and large black circles. There was no co-localization with CD34+ cells for cell cycle.

