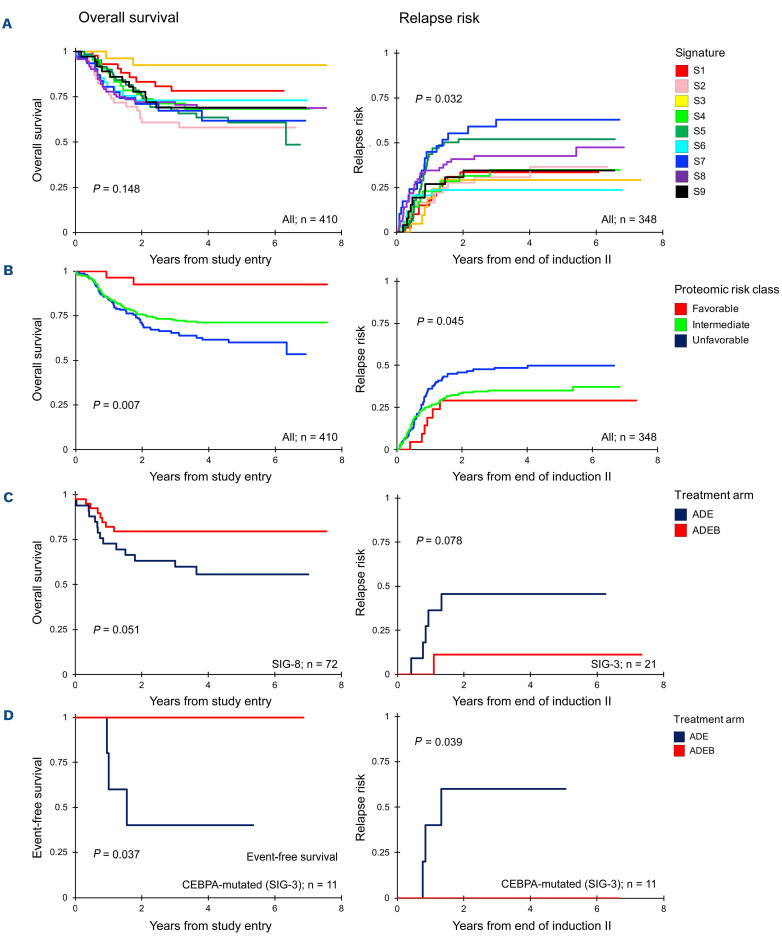
Figure 5.
Kaplan-Meier curves for overall survival, event-free survival and relapse risk. Left upper three panels: overall survival curves (log-rank), right panels: relapse risk (Gray statistics). (A) Overall survival and relapse risk stratified by the nine protein expression signatures (PrSIG). (B) Proteomic risk groups defined as “favorable”, “intermediate”, “unfavorable”. (C) Comparison of outcomes in patients treated with ADE or. ADEB in PrSIG-8 (left) and PrSIG-3 (right). (D) Event-free survival and relapse risk for CEBPA-mutated patients in PrSIG-3 treated with ADE (blue) or ADEB (red).

