Figure 2.
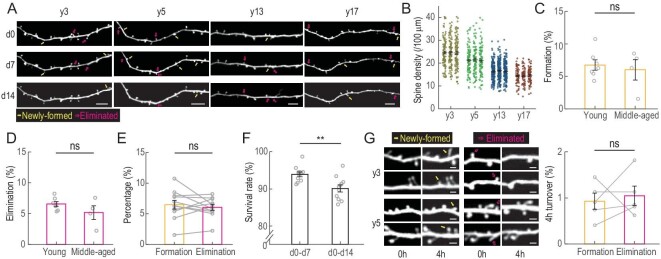
Temporal dynamics of dendritic spines in macaque prefrontal cortex. (A) Example images of the same apical dendrites in dlPFC of four monkeys (y3, y5, y13, y17) obtained by repeated two-photon imaging on d0, d7 and d14. Yellow arrows, newly formed spines; magenta arrows, eliminated spines. Scale bars, 10 μm. (B) Spine density of four monkeys of different ages. Each data point represents one dendritic segment. (C and D). Percentages of spines that were newly formed (C) or eliminated (D) within the 7-day imaging interval in dlPFC of young (y3 and y5) and middle-aged (y13 and y17) monkeys during the first imaging cycle. (E) Averaged 7-day spine formation and elimination rates shown by connected open circles for all injection sites from all four monkeys. (F) Percentages of spines that persisted after 7 and 14 days. (G) Spine dynamics within 4-hour imaging intervals of young monkeys. Left, example images of the same apical dendrites in dlPFC of y3 and y5 obtained by repeated imaging. Yellow arrows, newly formed spines; magenta arrows, eliminated spines. Right, percentages of newly formed (yellow) and eliminated (magenta) spines. Scale bar, 2 μm. Data are presented as mean ± SEM. Each circle represents data from one virus injection site, n = 7 sites for young and n = 4 for middle-aged monkeys, n = 5 sites for (G). Student's t-test was used in (C), (D) and (F), paired Student's t-test in (E) and (G); ns, not significant; *P < 0.05; **P < 0.01; ***P < 0.001.

