Figure 4.
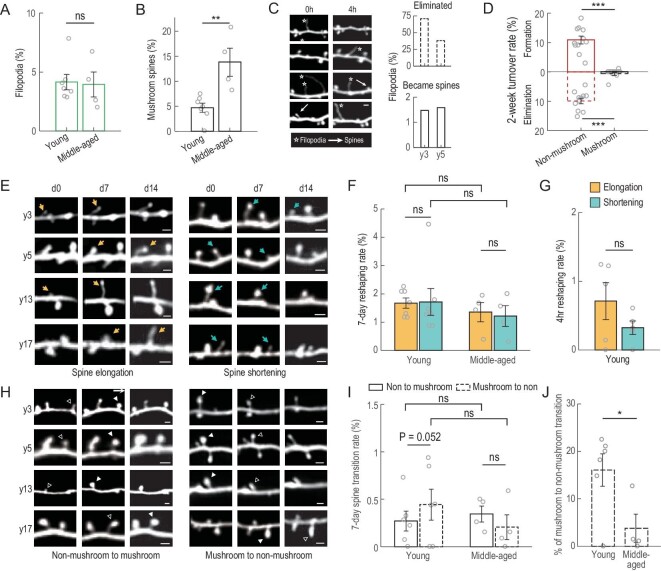
Morphological changes of spines and filopodia. (A) Percentages of filopodia among all protrusions observed in young and middle-aged monkeys. (B) Percentages of mushroom spines observed in young and middle-aged monkeys. (C) Filopodia dynamics within a 4-hour interval in young monkeys. Left: example images showing 4-hour dynamics for filopodia. White arrows, spine; white stars, filopodia. Right: percentages of filopodia that were eliminated or became spines within the 4-hour interval. Scale bars, 2 μm. (D) Formation (solid) and elimination (dashed) rates of non-mushroom (red) and mushroom (black) spines at 2-week intervals. (E) Example images showing elongation (yellow arrow) and shortening (blue arrow) of non-mushroom spines in four monkeys. Scale bars, 2 μm. (F) Percentages of non-mushroom spines undergoing elongation (yellow) and shortening (blue) within 7-day intervals for young and middle-aged monkeys. (G) Percentages of non-mushroom spines undergoing elongation (yellow) and shortening (blue) within 4-hour intervals for young monkeys. (H) Example images showing non-mushroom (open triangle) to mushroom (solid triangle) transitioning (left), and the reverse (right) in four monkeys. Scale bars, 2 μm. (I) Non-mushroom to mushroom spine transition (percentage of all spines, solid bars) and mushroom to non-mushroom (percentage of all spines, dashed bars) within 7-day intervals for young and middle-aged monkeys. (J) Mushroom to non-mushroom spine transition (percentage of all mushroom spines) within 7-day intervals for young and middle-aged monkeys. Data are presented as mean ± SEM except (C). Each circle represents data from one virus injection site, n = 7 sites for young and n = 4 for middle-aged monkeys; n = 5 sites for (G); n = 6 sites for young monkeys in (D) (mushroom), (I) and (J). Student's t-test was used; ns, non-significant; *P < 0.05; **P < 0.01; ***P < 0.001.

