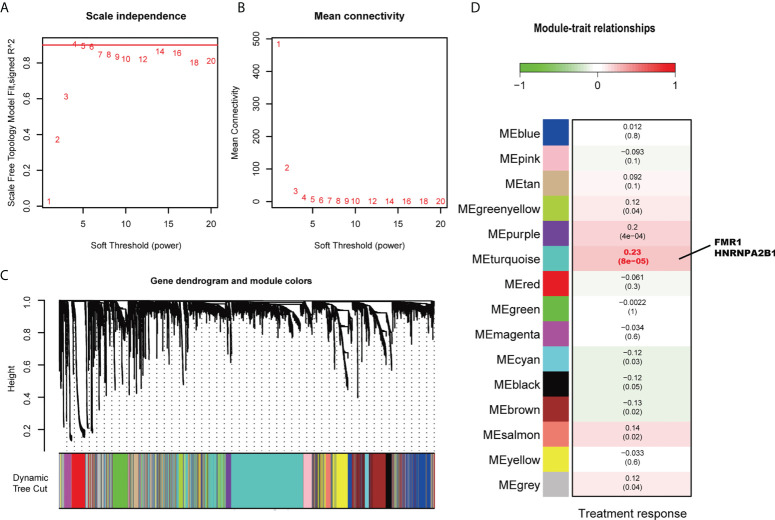
Figure 3.
Weight Gene Co-expression Network Analysis. (A) Analysis of the scale-free index for various soft power thresholds. (B) Analysis of the mean connectivity of various soft power thresholds. (C) Dendrogram of the genes clustered based on a dissimilarity measure (1-TOM). (D) Average gene significances and errors in the modules associated with treatment response. The turquoise module was the most significantly correlated to treatment response. FMR1 and HNRNPA2B1 are in this module.

