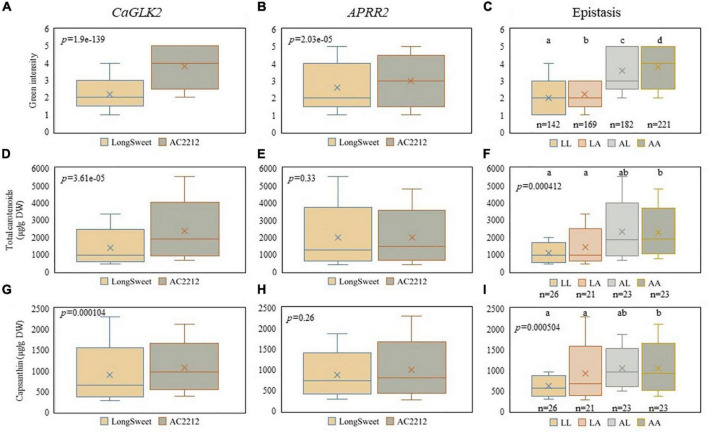
FIGURE 5.
Comparison between genes related to chlorophyll synthesis and carotenoid contents. Boxplots of green fruit color intensity distribution and (A) CaGLK2, (B) APRR2, and (C) both genes. Boxplots of total carotenoid contents (μg/g DW) distribution and (D) CaGLK2, (E) APRR2, and (F) both genes. Capsanthin contents (μg/g DW) distribution regulated by (G) CaGLK2, (H) APRR2, and (I) interaction of two genes.

