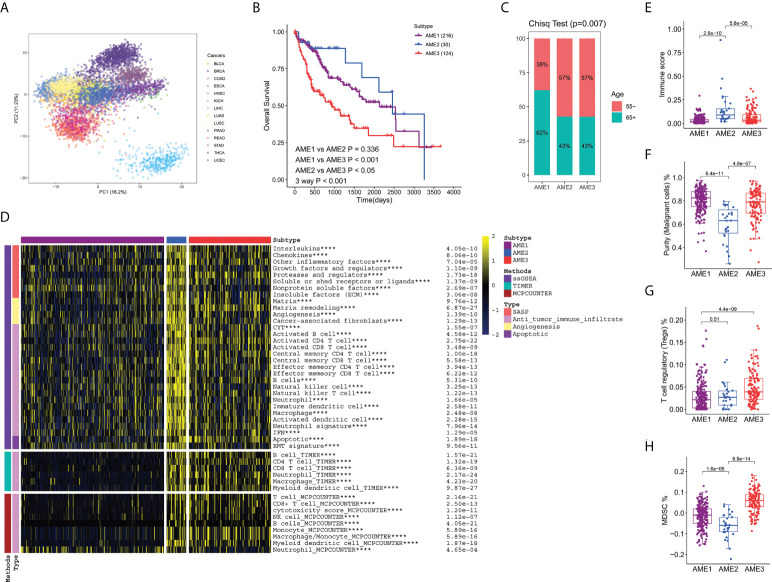
Figure 1.
Identification of three prognosis-distinct aging microenvironment subtypes. (A) Principal Component Analysis (PCA) plot of 14 cancer types from TCGA. Based on the first two PCs of PCA, LIHC was characterized by a unique expression pattern of aging-related genes, which was completely different from those of other cancer types. (B) Kaplan–Meier estimates of overall survival of the three aging microenvironment subtypes. AME2 patients had the highest survival rate, whereas patients in the AME3 subtype had the worst prognosis outcomes. (C) The proportion of different ages of patients in the three subtypes. (D) Heatmap of immune features in subtypes, calculated by single sample gene set enrichment analysis (ssGSEA), Tumor Immune Estimation Resource (TIMER), and Microenvironment Cell Populations-counter(MCPCOUNTER). **** P<0.0001). (E) Boxplots of the immune score in the subtypes. (F) Boxplots of the purity of the tumor cells in the subtypes. (G) Boxplots of the proportion of regulatory T cells (Tregs) in the subtypes. (H) Boxplots of the proportion of Myeloid-derived suppressor cells (MDSCs) in the subtypes. Kruskal–Wallis test was performed in panels E–H, and P values are shown.

