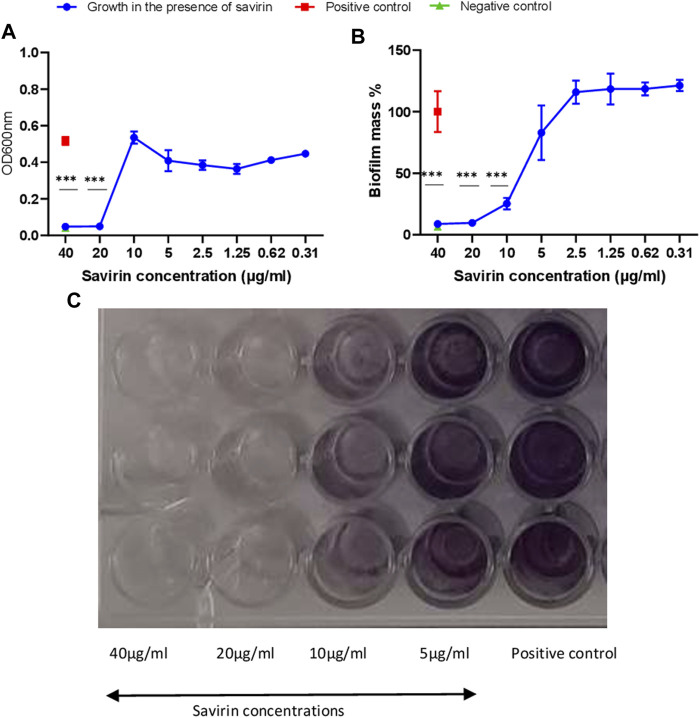
FIGURE 1.
Planktonic (A) and biofilm (B,C) growth of S. aureus in the presence of different savirin concentrations. Triplicate wells were used for each treatment (N = 3) and experiments were repeated twice. Data are presented as mean ± standard deviation (SD) and the error bars indicate SD (*** = p < 0.001).

