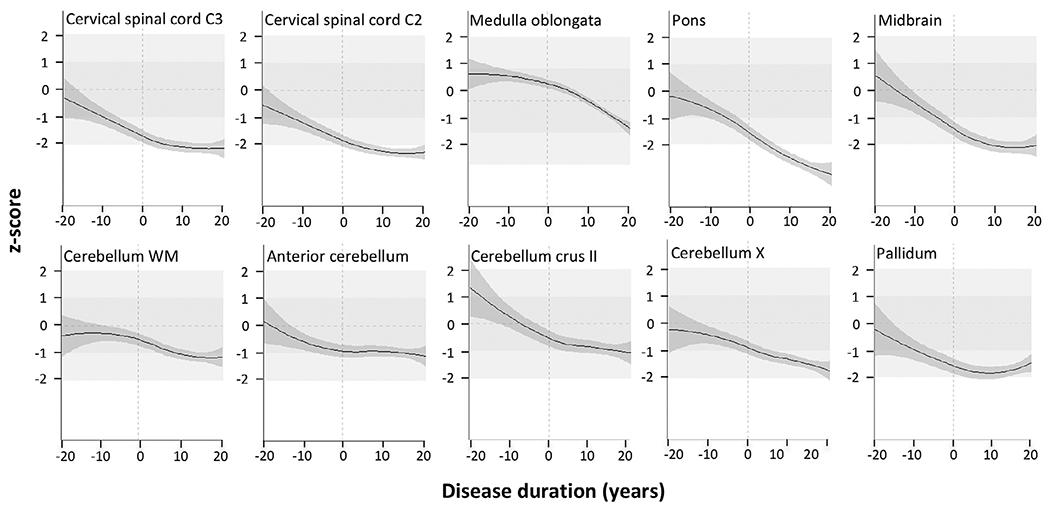
FIG. 1.

Regional volume loss along the time course of the disease. Each metric, being mean cross-sectional area of cervical spinal cord levels C2 and C3 and volumes of medulla oblongata, pons, midbrain, cerebellar white matter, anterior lobe of the cerebellum, cerebellar lobules crus II and X. and pallidum of SCA3 mutation carriers, was z-transformed in relation to healthy controls of the same age. The x axis represents the estimated disease duration in years. The estimated 95% confidence interval is given in dark gray. For a better orientation, the following reference lines and ranges are given: the vertical dashed line marks the estimated clinical onset; the horizontal dashed line marks the average of the healthy control group, represented by a z score of 0; the medium- and light-gray areas represent the range ± 1 and respective ±2 standard deviations of the healthy control group distribution.
