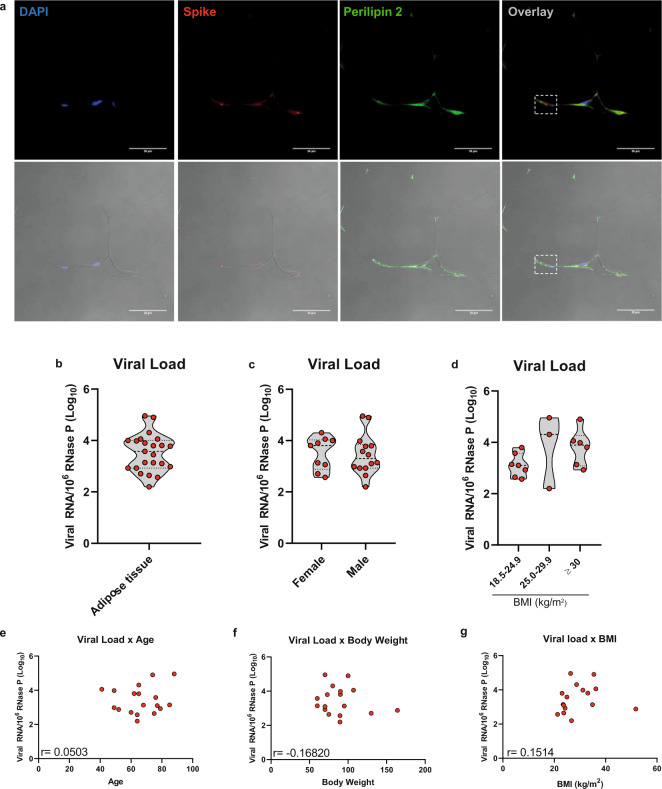
Fig. 1. SARS-CoV-2 infects human adipose tissue.
Thoracic subcutaneous adipose tissue samples of individuals who died of COVID-19. a Representative immunofluorescence images of 6–8 frames of two individuals. DAPI, blue. SARS-CoV-2 spike protein, red. Perilipin 2, green. The dashed box marks an area of an overlay with a concentration of spike labeling. The bottom panels are the overlay with the bright field. Scale bar = 50 µm. b–d Copy number of the SARS-CoV-2 genome normalized by 106 copies of the endogenous RNase P gene as evaluated by RT-qPCR in the adipose tissue biopsies (n = 23) (b) and stratified by sex (n = 23) (c), and body mass index (BMI) (n = 16) (d). Violin plots show median, first and third quartiles of the means related to genomic copies, where each dot represents a biological sample. Two-tailed Student’s t-test and one-way ANOVA was applied in (c) and (d), respectively. No significant differences were found. e–g Correlation between copy number of the SARS-CoV-2 genome (normalized by 106 copies of the endogenous RNase P gene) and age (n = 18) (e), body weight (n = 17) (f) and BMI (n = 16) (g). Only individuals that exhibited detectable levels of SARS-CoV-2 RNA in adipose tissue and had information about age, body weight, or BMI were used in the analysis (represented by dots in the correlation plot). Pearson correlation analysis was applied and no significant correlation was found. Source data are provided as a Source Data file and donor characteristics are shown in Supplementary Table 1 as averages. These experiments were repeated once with similar results.

