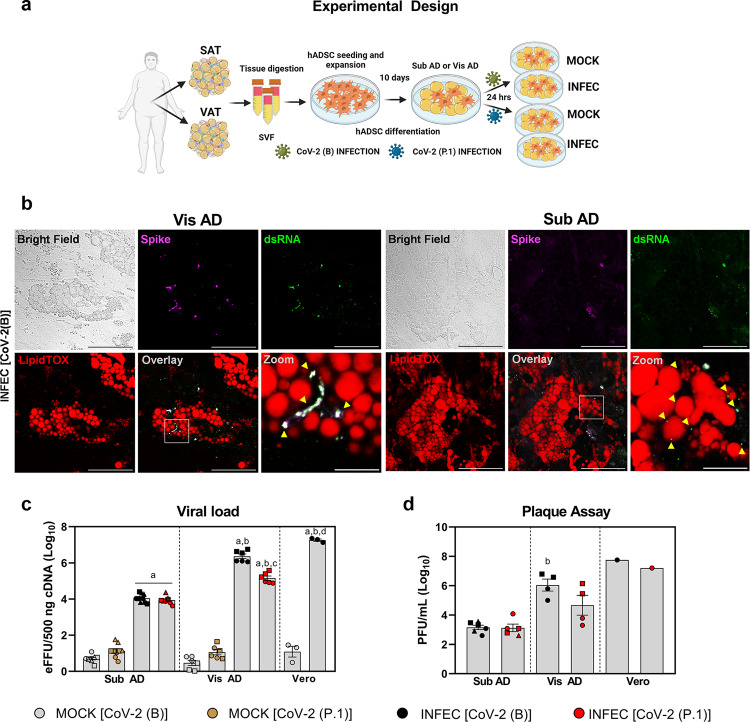
Fig. 2. The degree of adipose tissue cell infection depends on the anatomical origin of the cells and the SARS-CoV-2 lineage.
a Human adipose-derived stromal-vascular cells (hADSCs) were obtained from abdominal subcutaneous (SAT) and omental visceral (VAT) adipose tissues, differentiated in adipocytes (Sub AD and Vis AD, respectively), and infected (INFEC) or not (MOCK) with the SARS-CoV-2 ancient strain [CoV-2 (B)] or the P.1 variant [CoV-2 (P.1)]. Created with Biorender.com. b Cells were infected with MOI = 0.1 for 1 h and harvested 3 days after infection to allow better contrast and resolution of the replicating viruses. Representative immunofluorescence of six to ten images acquired from two to six independent pools of cells from two to three donors. SARS-CoV-2 spike protein, magenta. Double-stranded RNA (dsRNA), green. LipidTOX, red. Scale bar = 50 µm (zoom = 10 µm). c, d Cells were harvested 24 h after infection with MOI = 1 for 1 h to assess their susceptibility to viral infection under conditions where virus availability is not limiting. c Viral load determined by RT-qPCR. eFFU, equivalent to focus forming units. Three-way ANOVA was performed to determine effects of infection (P < 0.0001), viral lineage (P > 0.05), anatomical origin (P < 0.0001), and interactions between anatomical origin × infection (P < 0.0001), anatomical origin × viral lineage (P < 0.01), infection × viral lineage (P < 0.0001), and infection, anatomical origin, and viral lineage (P < 0.0001). Significant differences between groups were determined by Sidak’s multiple comparison test and depicted as: a, P < 0.0001 vs. MOCK; b, P < 0.0001 vs. Sub AD; c, P < 0.0001 vs. CoV-2(B); d, P < 0.0001 vs. Vis AD. d Plate forming units (PFU) in the supernatant. Two-way ANOVA was performed to determine the effects of anatomical origin (P < 0.0001), viral lineage (P > 0.05), and the interaction between anatomical origin and viral lineage (P > 0.05). Significant differences between groups were determined by Tukey’s multiple comparison test and depicted as: b, P < 0.01 vs. Sub AD. Data were mean ± SEM of two to three independent pools of cells from two to three donors. Vero cells were used as reference. Different donors are distinguished by circles, squares, and triangles, while independent pools of cells from the same donor (or Vero) are marked by the same symbol. Source data are provided as a Source Data file. These experiments were repeated once with similar results.

