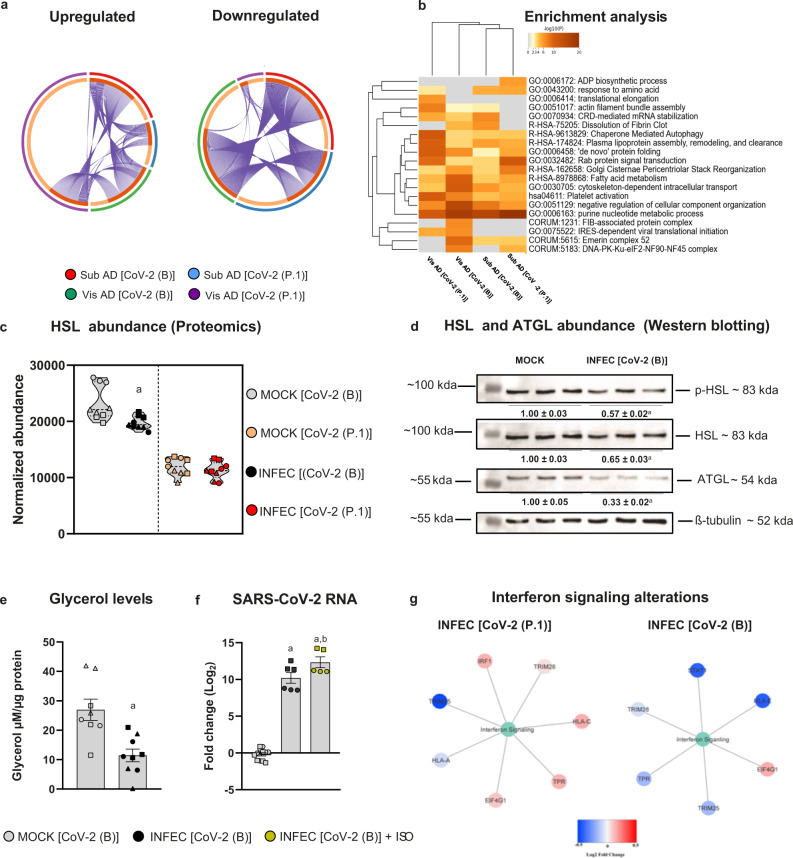
Fig. 4. SARS-CoV-2 infection of fat cells results in different cellular responses depending on the depot of origin and the viral lineage.
Stromal-vascular cells from human subcutaneous and visceral fat depots were differentiated into adipocytes (Sub AD and Vis AD, respectively) and infected (INFEC) or not (MOCK) with the SARS-CoV-2 ancient strain [CoV-2(B)] or the P.1 variant [CoV-2(P.1)]. a Overlap between differentially expressed proteins as determined by proteomics. Arcs represent different infection conditions (outside) or differentially expressed proteins (inside). Dark and light orange represent proteins that are differentially expressed in multiple conditions (linked by purple lines) or in only one condition, respectively. b Enriched ontology clusters. Statistically enriched terms were hierarchically clustered and the top-ranked terms within each cluster were displayed. c HSL abundance. Significant differences were determined by ANOVA and depicted as: a, P < 0.01 vs. MOCK CoV-2(B). d Western blotting of phosphorylated HSL (p-HSL), total HSL, ATGL, and α-tubulin as the loading control. Quantification represents the mean ± SEM of three independent pools from one donor. Significant differences were determined by a two-tailed Student’s t-test: a, P < 0.01. e Glycerol released in the medium. Significant differences were determined by a two-tailed Student’s t-test: a, P = 0.0018. f SARS-CoV-2 genome in the supernatant of cells treated or not with 10 μM isoproterenol (ISO). Significant differences were determined by one-way ANOVA with Tukey’s multiple comparison test and depicted as: a, P < 0.0001 vs. MOCK and b, P < 0.05 vs. INFEC[CoV-2(B)]. g Protein–protein interaction analysis using proteins related to the Reactome term “Interferon Signaling”. e, f are mean ± SEM of two to six independent pools of cells from two to three donors. Proteomics were run using samples from two to three donors in technical triplicate. Different donors are distinguished by circles, squares, and triangles, while independent pools of cells from the same donor are marked by the same symbol. Source data are provided as a Source Data file and in Supplementary Data 1 and 2. The experiments were repeated once with similar results, with the exception of (e, f), which were not repeated; although the interassay variability was low, controls worked as expected, and biological and technical variability was accounted for in the analysis.

