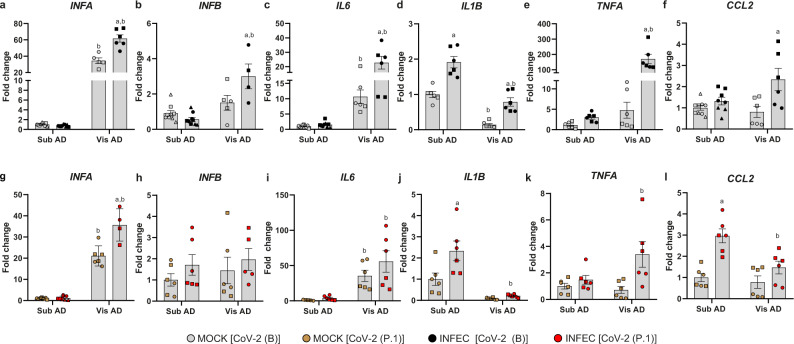
Fig. 5. Genes associated with inflammation are differentially expressed in SARS-CoV-2-infected adipose tissue cells.
a–l Stromal-vascular cells from human subcutaneous and visceral fat depots were differentiated into adipocytes (Sub AD and Vis AD, respectively) and infected (INFEC) or not (MOCK) with the SARS-CoV-2 ancient strain [CoV-2 (B)] (a–f) or the P.1 variant [CoV-2 (P.1)] (g–l). Gene expression as quantified by RT-qPCR 24 h post-infection. Two-way ANOVA with Tukey’s multiple comparison test was applied to identify differences between groups. These differences are depicted in letters: a, P < 0.05 vs. respective MOCK; b, P < 0.05 vs. respective Sub AD. Data represent the mean ± SEM of two to three independent pools of cells from two to three donors. Different donors are distinguished by circles, squares, and triangles, while independent pools of cells from the same donor are marked by the same symbol. Source data are provided as a Source Data file. These experiments were not repeated; although the calculated interassay variability for these genes was low, controls worked as expected, and biological and technical variability was accounted for in the analysis.

