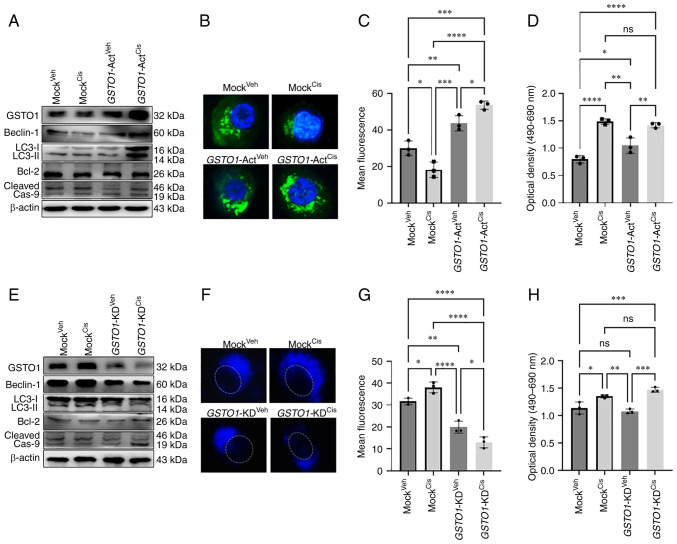
Figure 3.
GSTO1 activation in WT HCT-116 cells induces autophagy following cisplatin treatment, whereas GSTO1 inhibition in MDR cells induces apoptosis. GSTO1 was overexpressed using GSTO1-Act CRISPR plasmid transfected in WT HCT-116 cells. (A) Western blotting was performed to determine the protein expression levels of GSTO1 expression as well as autophagy and apoptosis marker proteins. (B) Fluorescence images of autophagic vesicles stained with Cyto-ID® Autophagy reagent (green) in Mock- and GSTO1-Act plasmid-transfected WT cells (×1,000 magnification); nuclei are stained with DAPI (blue). (C) Quantification of fluorescence intensity of the data presented in part (B); one-way ANOVA was used for statistical analysis. (D) Cell death was analyzed using an LDH ELISA assay; one-way ANOVA was used for statistical analysis. GSTO1 was inhibited using the GSTO1-KD CRISPR/Cas9 plasmid in MDR cells. (E) Western blotting was used to assess protein expression levels of GSTO1 as well as autophagy and apoptosis marker proteins. (F) Representative fluorescence images of autophagic vesicles stained with monodansylcadaverine (blue); the dashed white line indicates the outline of the nucleus (×1,000 magnification). (G) Quantification of fluorescence intensity of the data presented part (F); one-way ANOVA was used for statistical analysis. (H) Cell death was analyzed using an LDH ELISA assay; one-way ANOVA was used for statistical analysis. *P<0.05; **P<0.01; ***P<0.001; ****P<0.0001. Act, activation; cas, caspase; cis, cisplatin; GSTO1, glutathione-S-transferase Ω-1; KD, knockdown; LDH, lactate dehydrogenase; MDR, multidrug resistant; ns, not significant; veh, vehicle; WT, wild-type.

