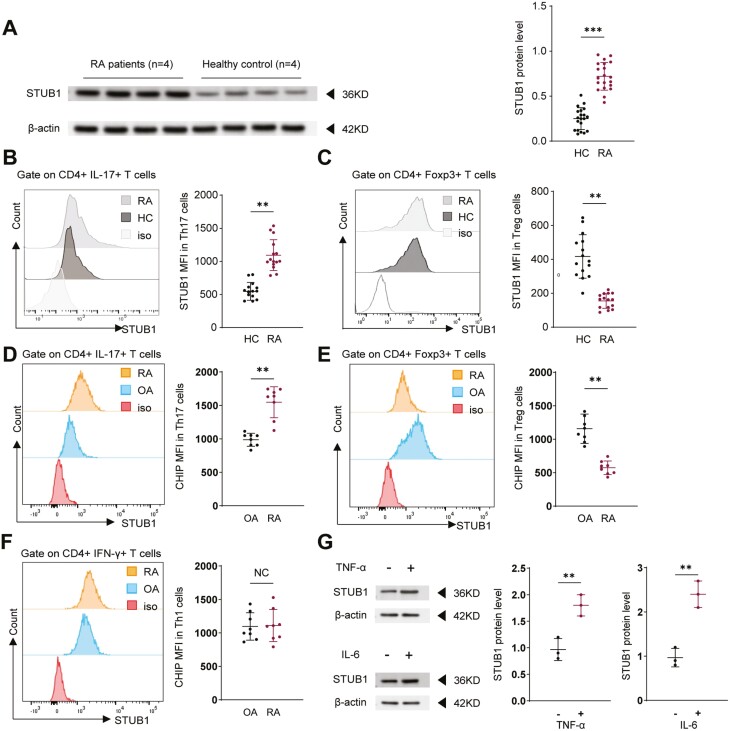
Figure 1.
: The STUB1 protein level in patients with rheumatoid arthritis (RA) and control groups. (A) CD4+ T cells were isolated from RA patients (n = 4) and healthy controls (n = 4). The expressive protein levels of STUB1 were performed by Western blot. The STUB1 protein levels were quantified by band intensity and normalized to β-actin levels. STUB1 protein expression in CD4+IL-17+ T (Th17) cells (B) and CD4+Foxp3+ T (Treg) cells (C) from RA PB (n = 15) and HCs PB(n = 15). (D-F) STUB1 levels in the SF of RA patients were detected, and osteoarthritis patients (OA) were included as a control group. The expression of STUB1 in Th17 cells (D) and Treg cells (E) from RA SF (n = 8) and controls (OA) SF(n = 8). (F) The expression of STUB1 in Th1 cells from SF of RA patients (n = 8) and controls (OA) (n = 8). (G) CD4+ T cells were stimulated with or without TNF-α and IL-6, respectively. The levels of STUB1 were performed by Western blot and data are representative of three independent experiments. ** P <.01 and *** P <.001 vs. healthy controls (Student’s t test). Error bars show mean ± SEM. STUB1, STIP1-homologous U-Box containing protein 1.

