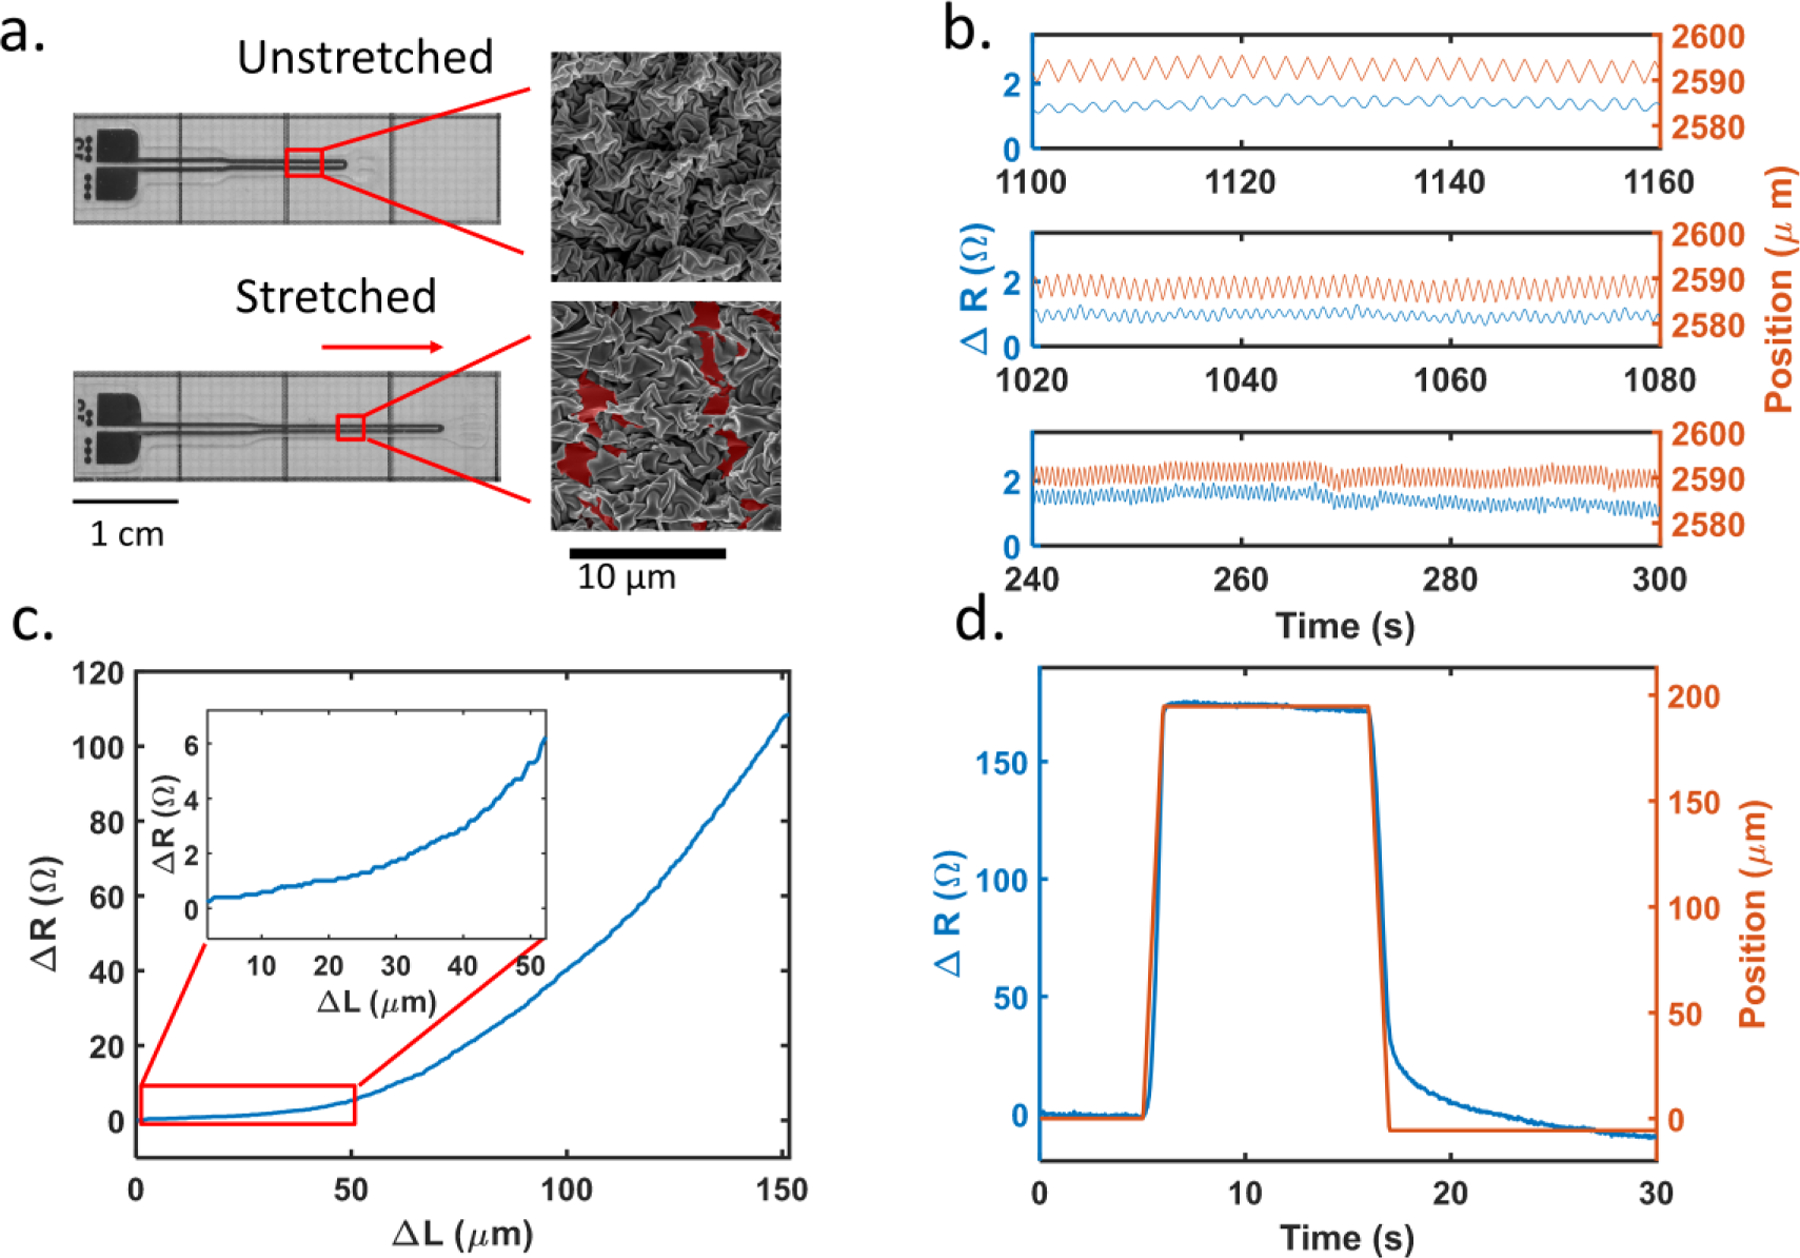
Fig. 1.

(a) Unstretched (top) and stretched (bottom) sensors. On the right are scanning electron microscope images of sensor trace region. It is apparent on the SEM that the wrinkles align and stress in the direction of actuation. Fractures in the thin film have been illustrated by pseudo-coloring the exposed polymer layer in red. (b) Sensor’s resistance response under different cyclic frequencies (from top to bottom are 0.5, 1, and 2 Hz respectively). The sensor (blue) tracks the displacement of 5 μm (red) very well, and the baseline shift is captured for 2 Hz as well (~265 s). 5 μm corresponds to 0.025% strain of the sensor. (c) Representative sensitivity curve plotting change in resistance as a function of length up to 150 μm, with inset highlighting the 0 to 50 μm range; sensitivity increases with greater stretch non-linearly. (d) Response test of a representative sensor, blue line represents sensor’s resistance change while red line represents the relative change of the position of actuator. The sensor is stretched by 200 μm within 1 second. The mean latency between sensors and actuator is 50ms, (n=10).
