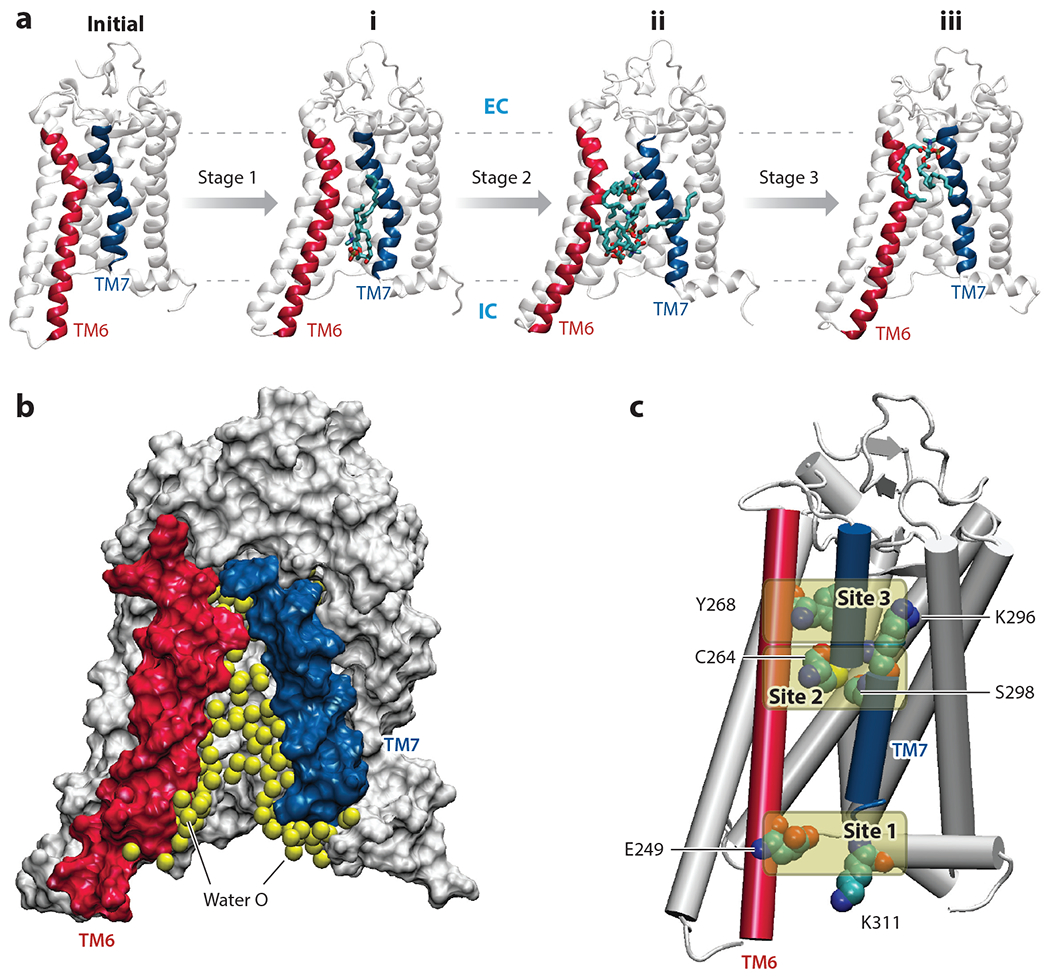
Figure 2.

Structural features enabling lipid scrambling. (a) Snapshots illustrating the gradual opening of the lipid pathway in the adaptive ensemble molecular dynamics (AEMD) simulations. Starting from the initial model [Protein Data Bank (PDB) ID 4J4Q] (82), Stage 1 simulations sampled the transient opening of the pathway between the intracellular (IC) ends of transmembrane (TM) 6 and TM7 and the initial lipid insertion (conformation i). When this structure was subjected to subsequent sampling (in Stages 2 and 3), the pathway widened further, allowing multiple lipids to penetrate the pathway (conformation ii) and eventually resulting in complete flip of the most advanced lipid (conformation iii). In the snapshots, TMs 6 and 7 are colored in red and blue, respectively. The penetrating lipids are shown in stick representation. The IC and extracellular (EC) surfaces of the membrane are shown as dashed lines. (b) The hydrophilic lipid translocation pathway is depicted by showing water oxygen atoms (yellow spheres) accumulating inside the region between TMs 6 and 7 during the AEMD simulations. The protein is shown in surface representation, with TMs 6 and 7 shown in red and blue, respectively. (c) Three sites along the TM6–TM7 interface engaged in long-lasting interactions with the headgroups of translocating lipids. Site 1 consists of the E249(6.32)–K311(7.58) pair of residues, Site 2 includes C264(6.47) and S298(7.45), and Site 3 consists of residues Y268(6.51) and K296(7.43) [the superscript numbers correspond to the Ballesteros-Weinstein general numbering scheme for G protein–coupled receptor residues (6)].
