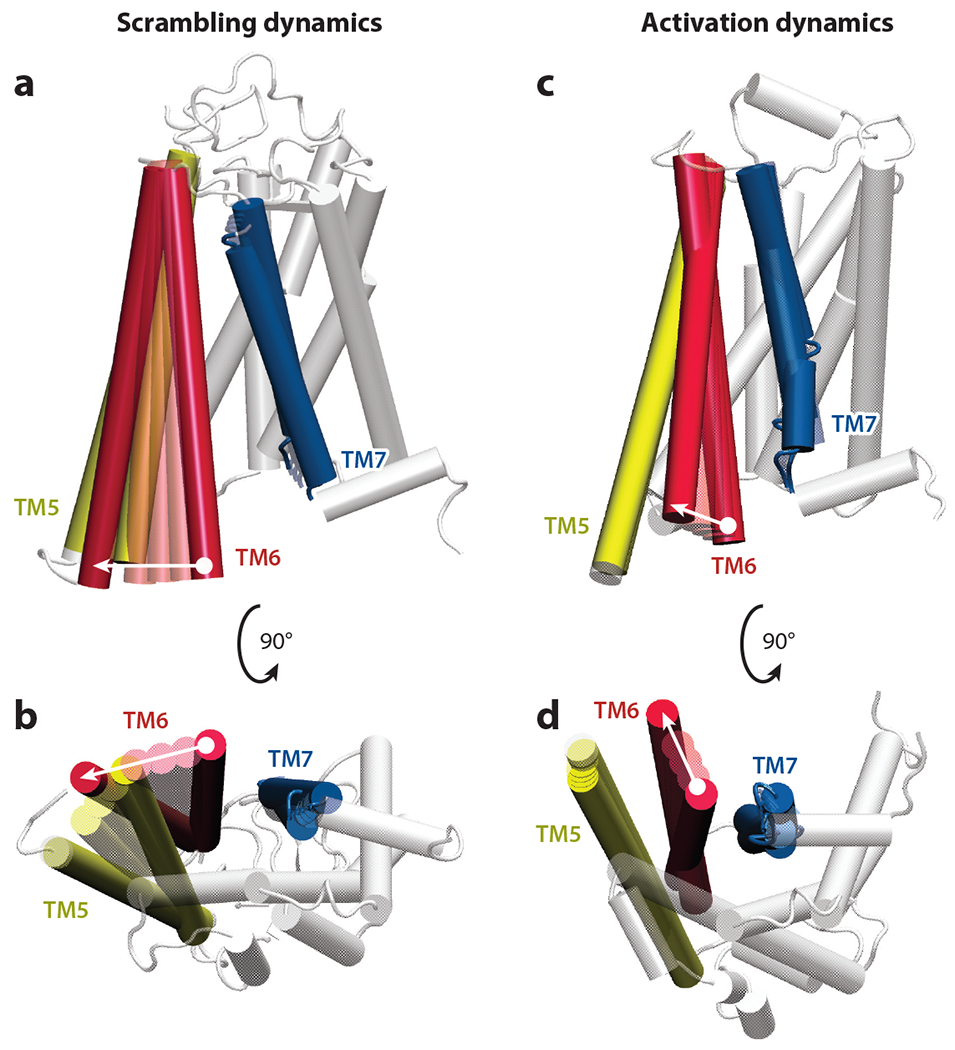
Figure 4.

Comparison of conformational changes associated with G protein–coupled receptor (GPCR)-mediated lipid scrambling and GPCR activation dynamics. Membrane and cytoplasmic views of movements of transmembrane (TM) helices during (a,b) lipid scrambling and (c,d) receptor activation are shown. Panels a and b show linear morphing of positions of opsin TMs 5, 6, and 7 during lipid scrambling; panels c and d show linear morphing of positions of β2-adrenergic receptor TMs 5, 6, and 7 during the activation process [between inactive and G protein–bound structures; Protein Data Bank IDs 2RH1 (19) and 3SN6 (97), respectively]. In each panel, the direction of movement in TM6 during the corresponding process is shown by the white arrow. The rest of the protein structure (white) is taken from the target structure used for morphing. Morphing was performed with the VMD plugin.
