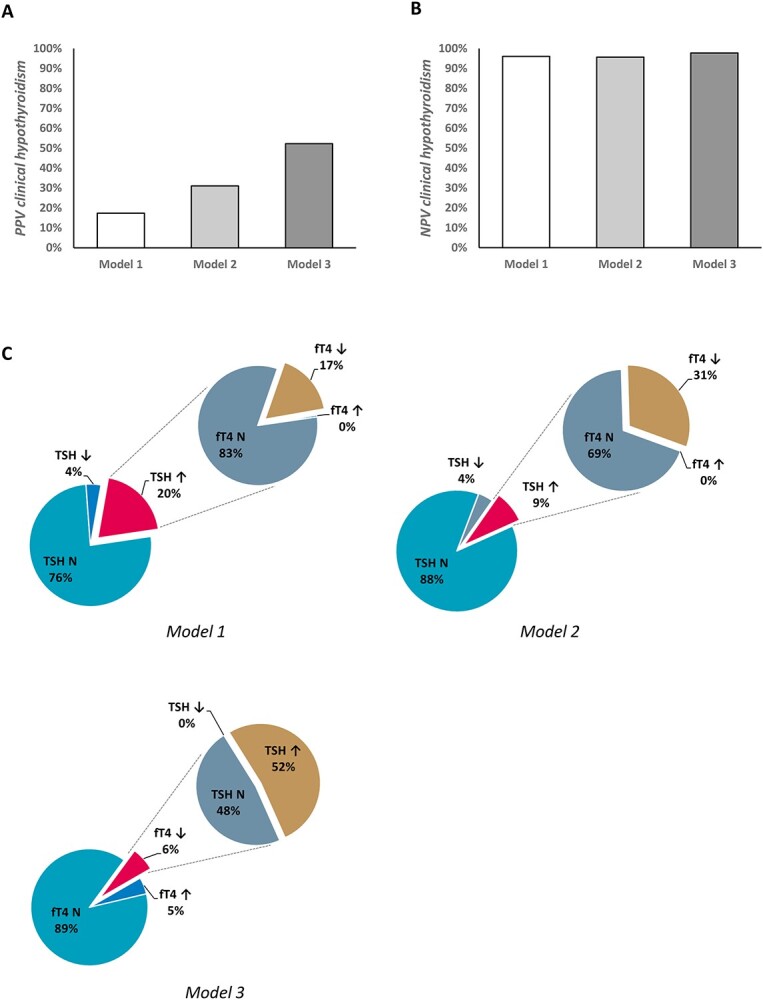
Figure 1.

Graphic display of the PPV (A), NPV (B) and (C) the proportions of subjects with deviating values of TSH and fT4, and hence the proportion of subjects diagnosed with (subclinical) hypothyroidism, in the different models. N = normal (value within the reference range).
