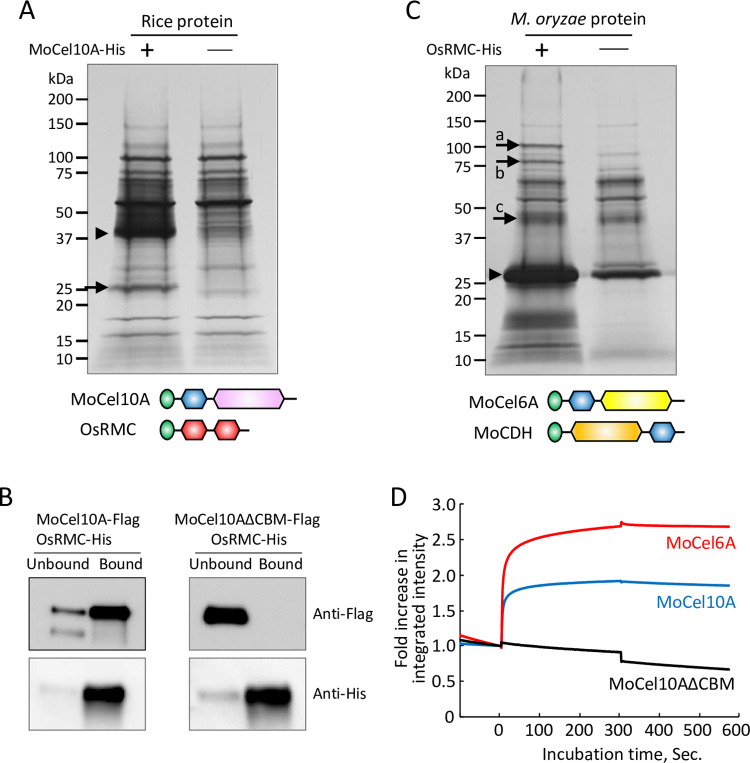
Fig 1. OsRMC binds to CBM1 of fungal enzymes.
(A) Protein extract from rice leaves 4 days after inoculation with M. oryzae (Ken53-33) was incubated with (+) or without (-) MoCel10A-His in the presence of His-resin. Fractions bound to His-resin were subjected to SDS-PAGE followed by silver staining. Arrowhead indicates MoCel10A-His. The protein band indicated by an arrow was identified by LC-MS/MS. Schematic structures of predicted full-length proteins of MoCel10A and OsRMC are shown: green, secretion signal peptide; blue, CBM1 (PF00734); pink, GH10 catalytic core domain (PF00331); red, DUF26 domain (PF01657). (B) OsRMC-His mixed with MoCel10A-Flag or MoCel10AΔCBM-Flag was applied to His-resin. Fractions unbound and bound to His-resin were subjected to SDS-PAGE followed by immunoblot analysis using anti-Flag and anti-His antibodies. (C) Culture filtrate from M. oryzae hyphae liquid culture was incubated with (+) or without (-) OsRMC-His in the presence of His-resin. Fractions bound to His-resin were subjected to SDS-PAGE followed by silver staining. Arrowhead and arrows indicate OsRMC-His and candidate proteins bound to OsRMC-His, respectively. Schematic structures of MoCel6A and OsCDH are shown: green, secretion signal peptide; blue, CBM1 (PF00734); yellow, GH6 catalytic core domain (PF01341); orange, CDH-cyt domain (PF16010). (D) Integrated intensity representing the binding kinetics of OsRMC to MoCel10A, MoCel6A, and MoCel10AΔCBM. Association of MoCel10A, MoCel6A, and MoCel10AΔCBM (10 μL, 2.0 μM) with OsRMC was measured from time 0 to 300 s. Binding buffer was used to measure protein dissociation from time 300 to 570 s. Fold increase in integrated intensity was calculated by dividing each trajectory by the value at time zero. Each curve is representative of three assays. Binding kinetic values were determined by calculating means ± SD of three independent determinations.

