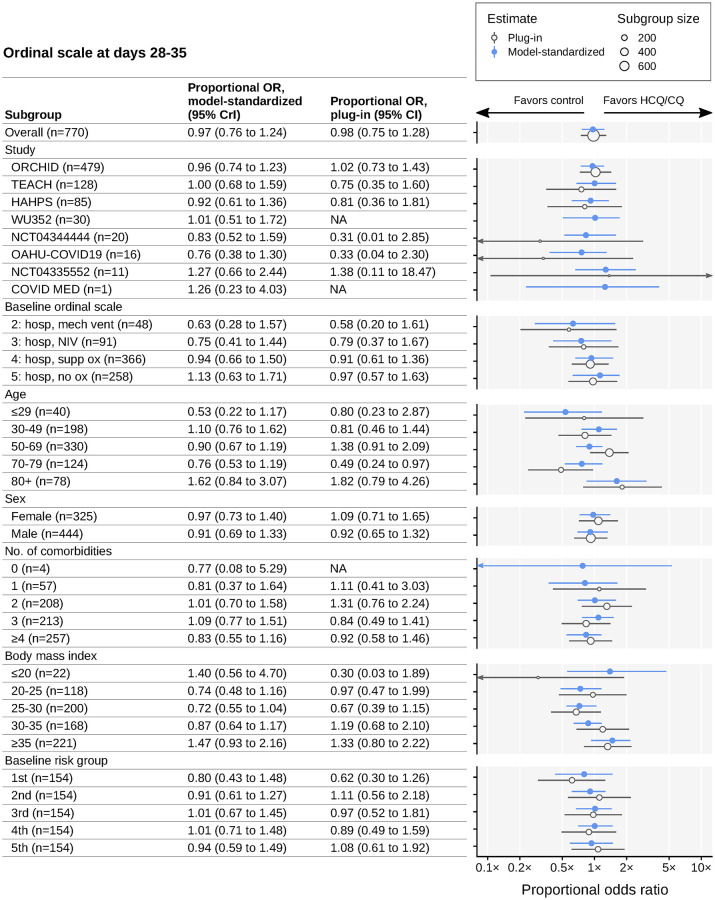
Fig 3. Subgroup analysis of differences in ordinal scale at days 28–35.
Estimated proportional odds ratios comparing day 28–35 ordinal scale in HCQ/CQ versus control groups. Estimates are given for the pooled patient population and for subgroups. Blue circles represent model-standardized estimates; blue horizontal lines represent 95% credible intervals. Open grey circles represent plug-in estimates; grey horizontal lines represent 95% confidence intervals. Grey circle size represents the number of patients in the corresponding subgroup. Arrows indicate uncertainty intervals extending beyond plot limits. Study acronyms are explained in Fig 1. Two trials did not have study acronyms (only trial registration numbers). Abbreviations: 95% CrI, 95% credible intervals; HCQ/CQ, hydroxychloroquine or chloroquine; NA, not applicable; NIV, noninvasive ventilation (includes BiPAP/CPAP and/or high-flow oxygen); OR, odds ratio.

