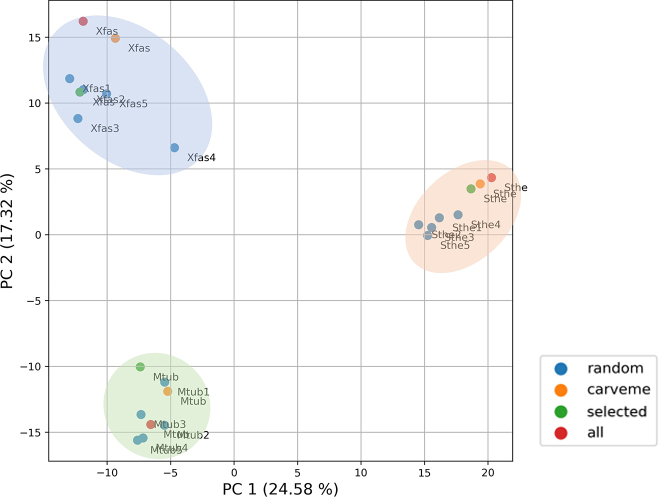
Figure 7:
PCA plot of the COG-annotated metabolic functions of all draft models generated by BIT, using different templates, and by CarveMe, for each bacterium. The plot shows the influence of principal components (PC) 1 and 2 on the variability of metabolic features, including the percentage of variance explained by each PC. The dots represent each draft model, and their colour corresponds to the approach used in its reconstruction. Each dot is annotated with the organism-specific identifier, consisting of the first letter of the genus and the first three letters of the species’ second name. The set of models for each organism is surrounded by ellipses that are only used for illustration purposes and do not represent real clusters.

