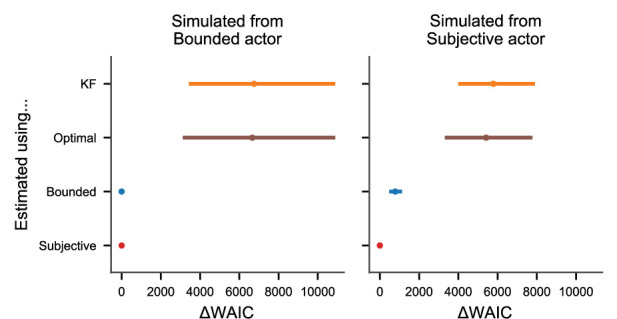
Figure 3. Inference on simulated data.
(A) Pairwise joint posterior distributions (0.5, 0.9, and 0.99 highest density intervals) inferred from simulated data from the subjective actor with parameters representative of real tracking data (, , , , , and ). The pink dots mark the true value used to simulate the data, while the black dots mark the posterior mode. (B) Average posterior means and average 95% credible intervals relative to the true value for different numbers of trials (200 repetitions each). (C) Model recovery analysis. Inferring perceptual uncertainty (, posterior mean relative to the true value) with each of the four models from data simulated from the bounded actor model and subjective actor model, respectively.
Figure 3—figure supplement 1. Model comparison for simulations.


