. 2022 Oct 10;11:e76635. doi: 10.7554/eLife.76635

Figure 5. Model comparison on motion-tracking data.

(A) Average cross-correlograms (CCGs) for S1 from Bonnen et al., 2017 and three models in different target random walk conditions. For the other two subjects, see Figure 3. (B) Difference in widely applicable information criterion (WAIC) w.r.t. best model.
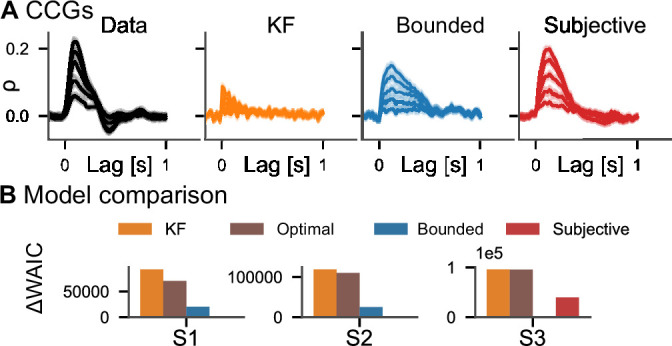
Figure 5.

Figure 5—figure supplement 1. Cross-correlograms (CCGs) for all subjects.
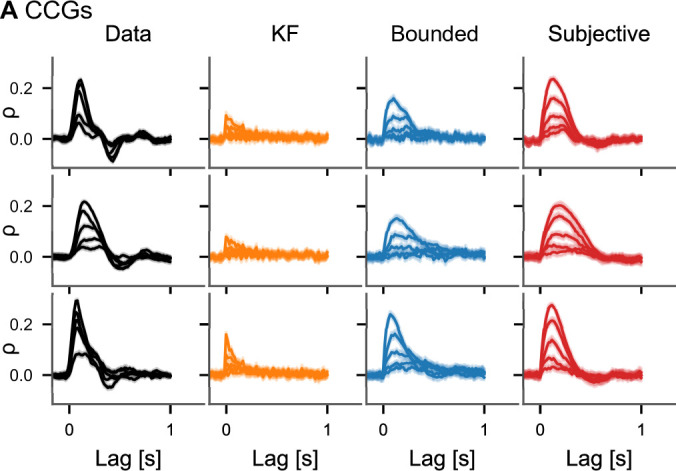
Figure 5—figure supplement 1.

(A) CCGs as in Figure 5 for all three subjects separately based on the data in experiment 2 from Bonnen et al., 2017.
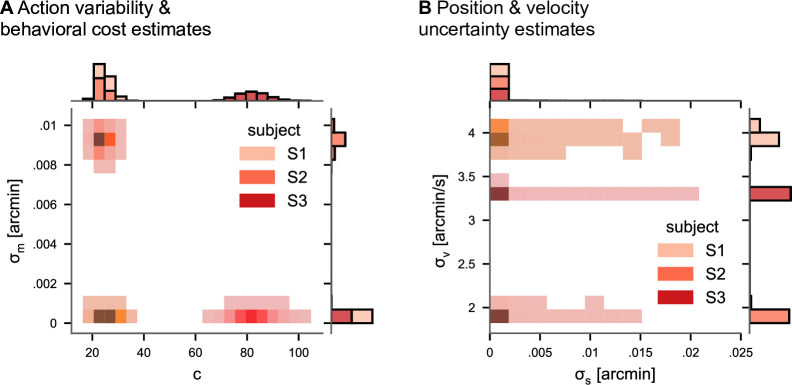
Figure 5—figure supplement 2. Posterior distributions of model parameters of the subjective model in experiment 2 (Bonnen et al., 2017).

Figure 5—figure supplement 2.

(A) Posterior distributions for action cost (c) and action variability (σm). (B) Posterior distributions for subjective stimulus dynamics parameters (position: σs, velocity: σv).