. 2022 Sep 29;11:e79926. doi: 10.7554/eLife.79926

Figure 6. Conformation change of SN25 induced by Rph3A.

(A, D) Illustration of the conformation change from random coils to α-helix in the SN1 of SN25 induced by Syx1 (2–253) and Syb2 (29–93), or by Rph3A, monitored by bimane-tryptophan quenching assay. Tryptophan was introduced at residue E55 and bimane fluorescence was labeled on residue R59C in SN25 FL (A) or SN25 11–206 (D). (B, C) Quenching of bimane fluorescence on the SN25 E55W/R59C with the addition of Syx1 and Syb2, and the addition of Rph3A FL or Rph3A-K3 mutant (B) and quantification of the results observed at 474 nm (C). (E, F) Quenching of bimane fluorescence on the SN25 (11–206) E55W/R59C with the addition of Syx1 and Syb2, or the addition of Rph3A FL (E) and quantification of the results observed at 474 nm (F). Data are presented as mean ± SEM (n=3), technical replicates. The significance were examined by one-way analysis of variance (ANOVA). *p<0.05; **p<0.01; ***p<0.001; ns, not significant.

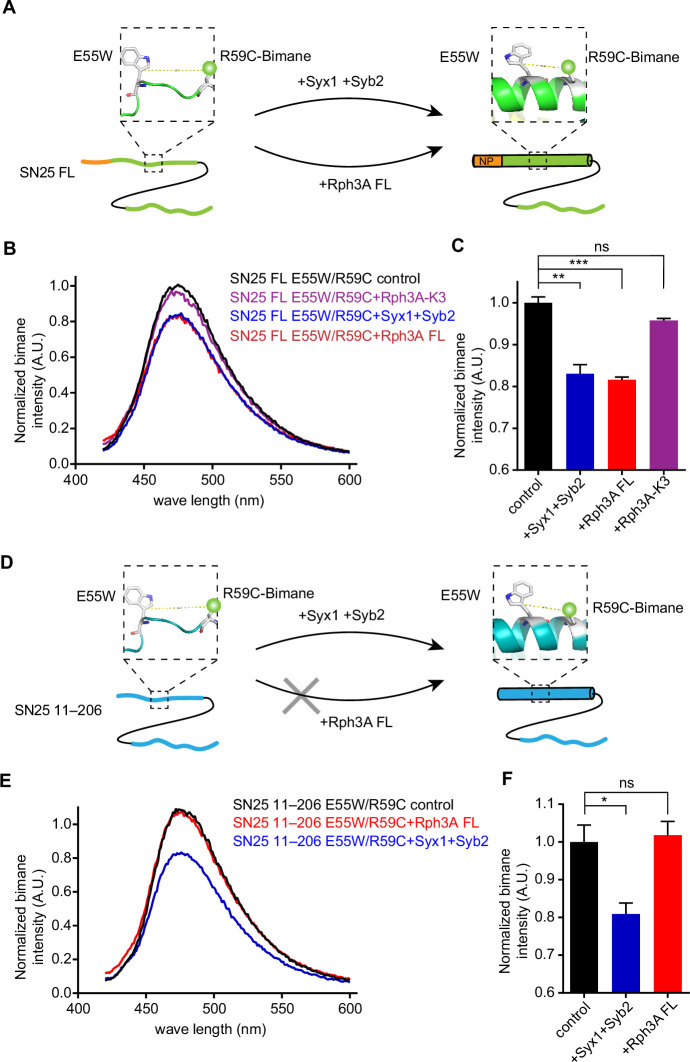
Figure 6—source data 1. Excel file with data used to make Figure 6C and F.

Figure 6.

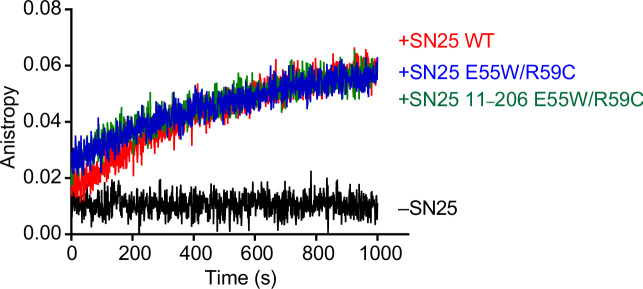
Figure 6—figure supplement 1. Assembly of the SNARE complex measured by fluorescence anisotropy.

Figure 6—figure supplement 1.

The SNARE complex assembly was performed with Syb2 (29–93, S61C-BDPY) and Syx1 in the presence of SN25 FL, SN25 W55W/R59C, or SN25 (11–206) E55W/R59C.
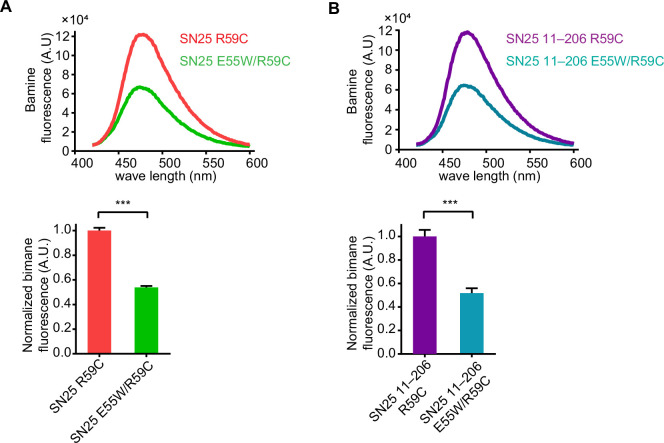
Figure 6—figure supplement 2. The intrinsic bimane fluorescence quenching by E55W mutant on SN25.

Figure 6—figure supplement 2.

(A) Comparison of bimane fluorescence between SN25 R59C labeling and SN25 E55W/R59C labeling. (B) Comparison of bimane fluorescence between SN25 11–206 R59C labeling and SN25 11–206 E55W/R59C labeling. Quantification of the bimane fluorescence observed at 474 nm in (A, B) is shown on the bottom. All data are presented as mean ± SEM (n=3), technical replicates. Differences among groups by unpaired Student’s t-test. ***p<0.001.
Figure 6—figure supplement 2—source data 1. Excel file with data used to make Figure 6—figure supplement 2.